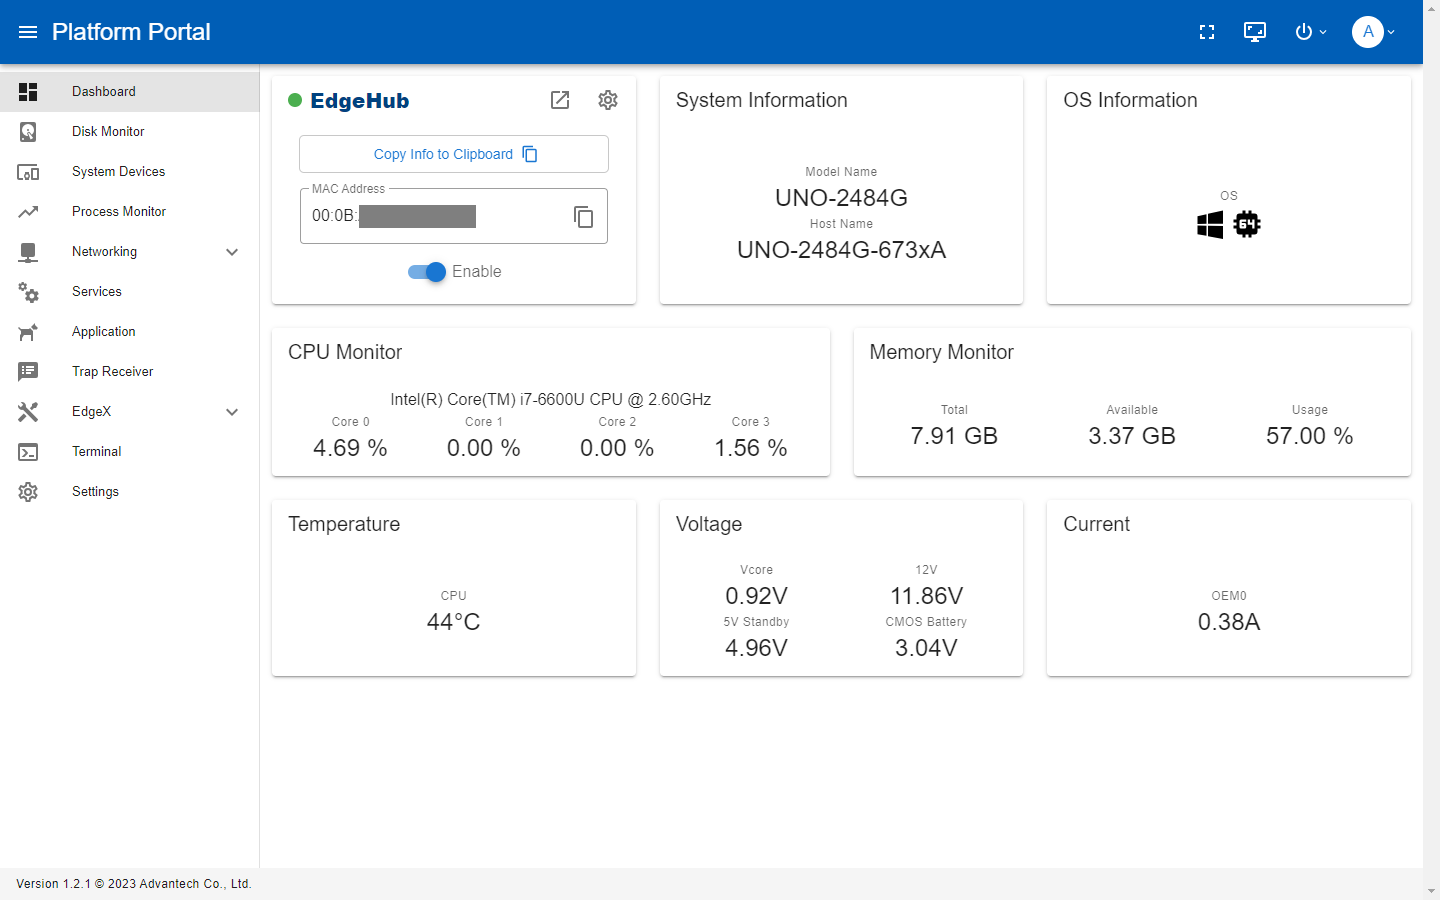
Platform Portal
The Advantech Platform Portal is a web-based tool for managing and configuring device settings and viewing diagnostic information over HTTP.
Toolbar

Toggle Navigation Drawer
![]()
Toggle fullscreen

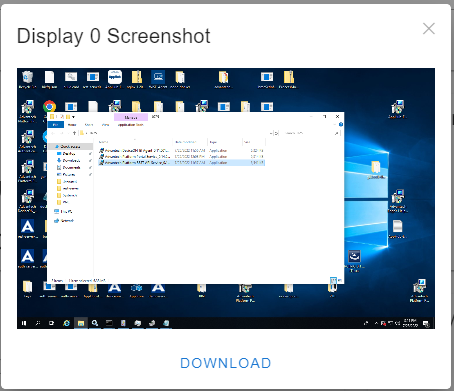
Take the host screenshot
Take a screenshot of the target device.

Power Button
The following functions are currently available.
- Shut down
- Restart
- Display On/Off (since 1.0.1)

User
To log out of your account, click the "Logout" button.

Using the admin account to log in, you can change your password through the Change Password menu.

Alternatively, you can change the password using the command line.
/auth-server.exe password reset
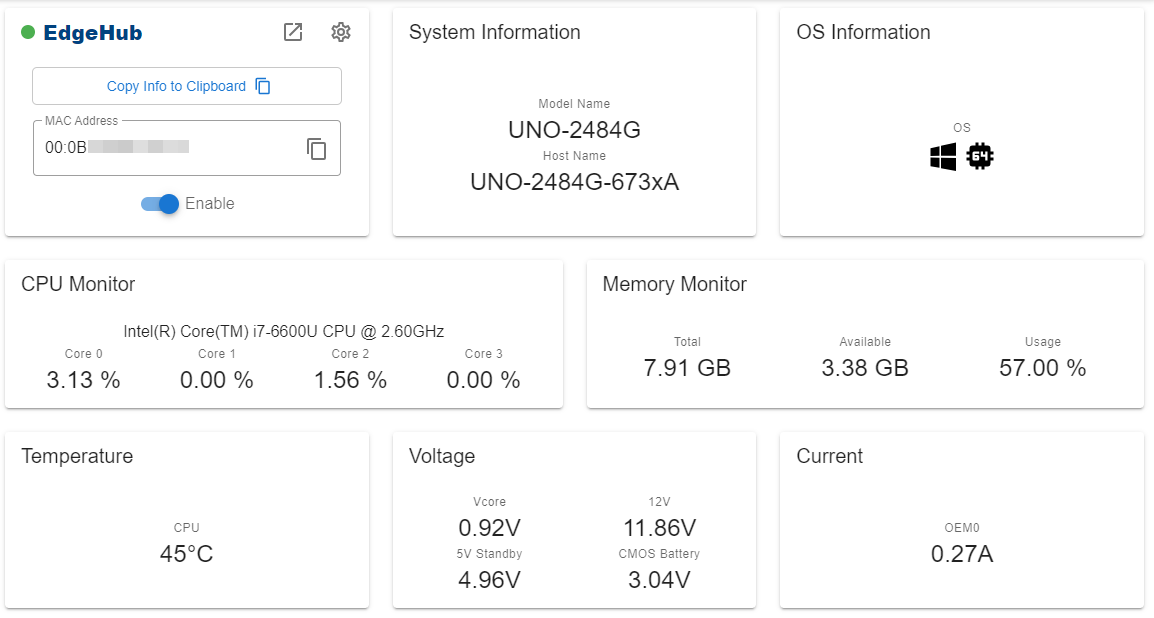
Dashboard
The Dashboard overviews the system's information and includes a widget for EdgeHub.
EdgeHub
You can use this widget to manage device credential settings and control the connection to EdgeHub.
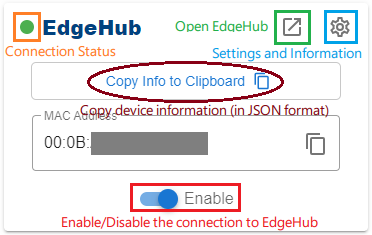
Device Credential
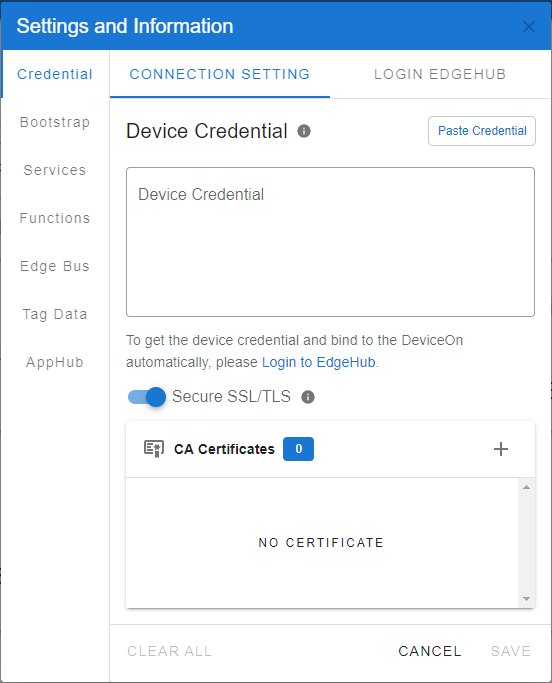
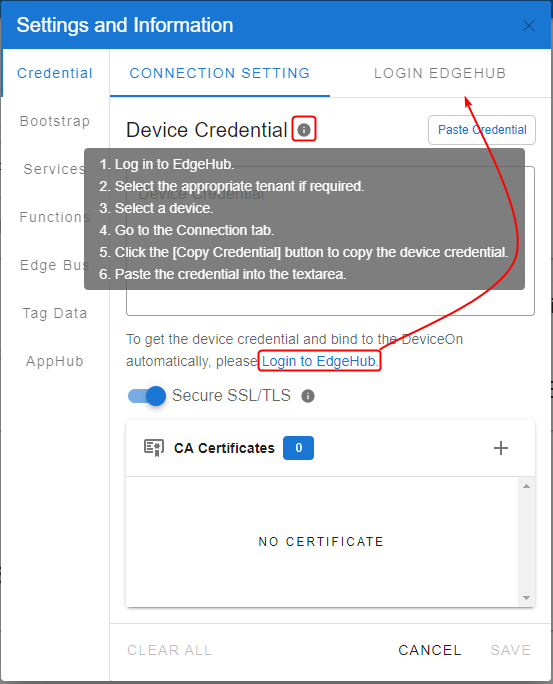
You can either manually copy the Device Credential from EdgeHub and paste it or retrieve it automatically by logging in to EdgeHub.
-
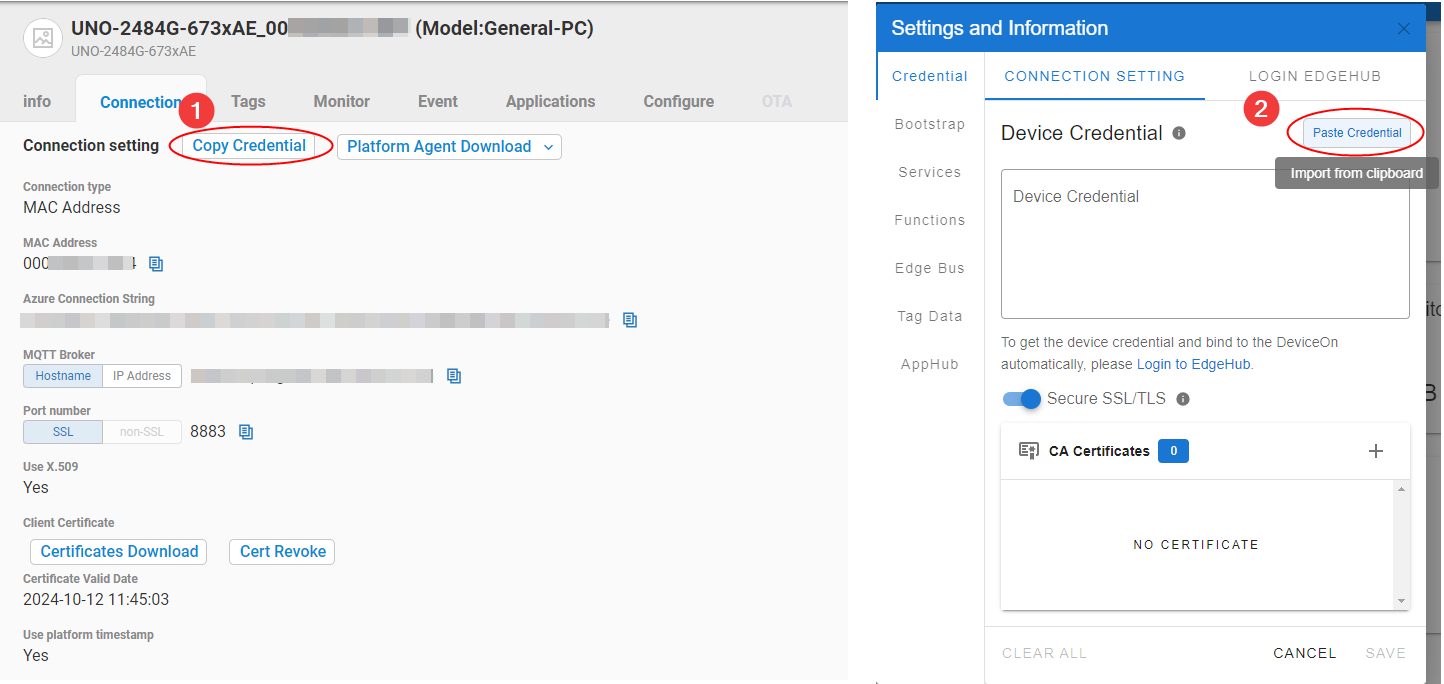
Manual Copy and Paste
Click the "Copy Credential" button on the "Connection" tab of a device in EdgeHub, then paste it into the "Device Credential" text area by clicking the "Paste Credential" button or using Ctrl+V.
-
Automatic Retrieval via EdgeHub Login
1. Log in with your EdgeHub account.
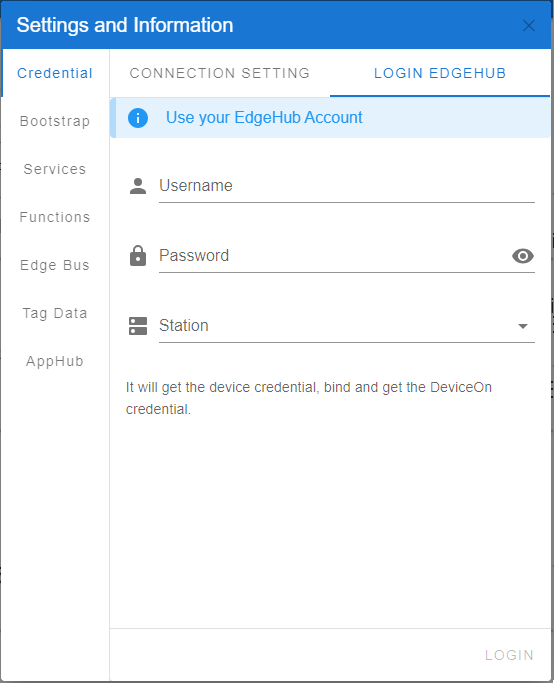
2. Select a tenant if required
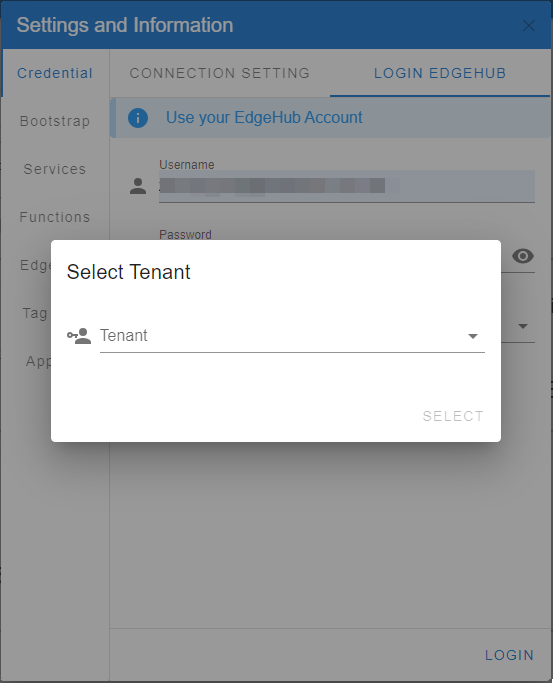
Now, you can click the SAVE button to apply the Device Credential to your device.
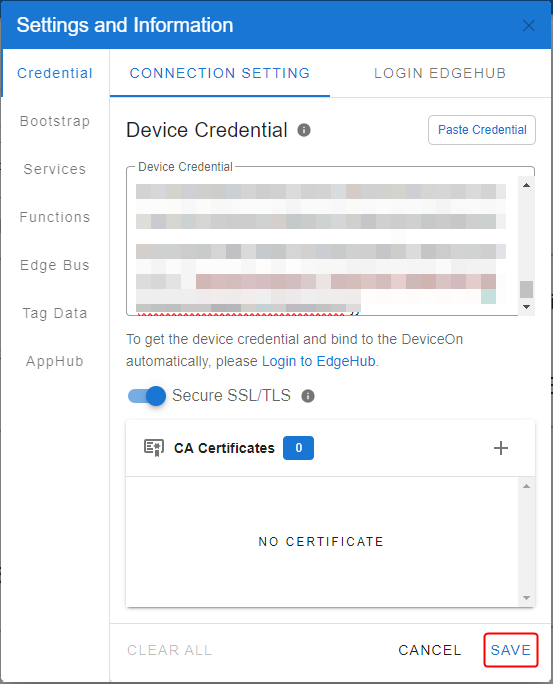
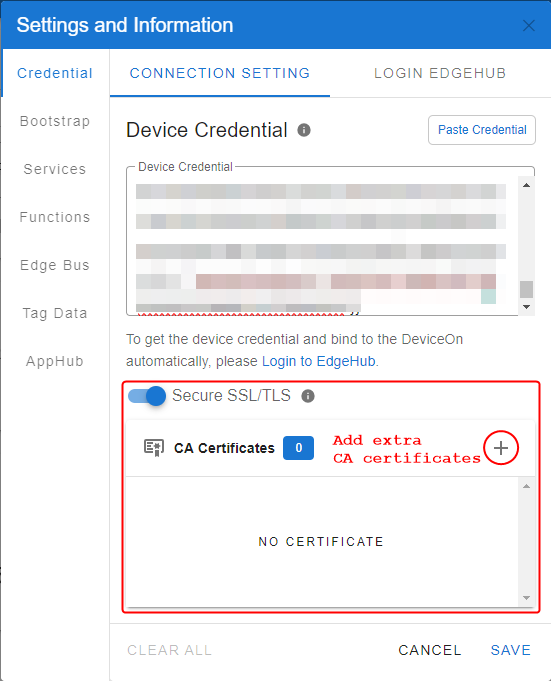
SSL/TLS Connection
The agent automatically enables SSL/TLS connection to the EdgeHub server. For servers with invalid certificates, such as self-signed or those using IP for the server, extra CA certificates can be added, or the Secure SSL/TLS can be disabled to bypass certificate verification.
Bootstrap
(since EdgeHub Suite 1.4.0)
Bootstrap allows you to configure EdgeHub settings for mass deployment, streamlining the deployment process for multiple devices.
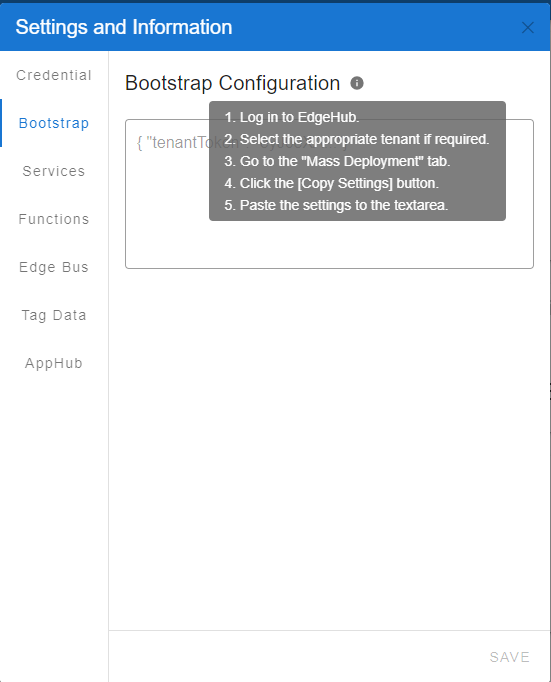
Steps:
- Log in to EdgeHub.
- Select the appropriate tenant (if applicable).
- Go to the "Mass Deployment" tab.
- Click the "[Copy Settings]" button to copy the configuration details.
- Paste the copied settings into the designated textarea.
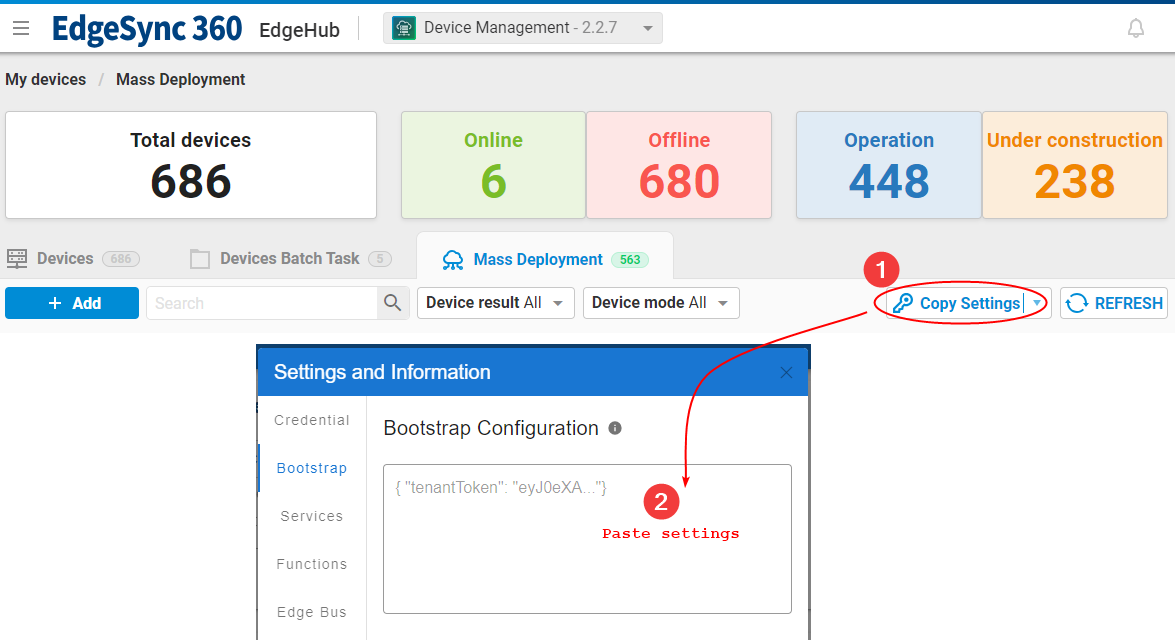
Note:
- Ensure devices are added to Mass Deployment before proceeding.
Alternative Configuration Method:
For an alternative configuration method, you can place the CFG file (token.cfg) in the same folder as:
- Windows: The EdgeHub Suite installation package.
- Linux: The
install.shfolder (after decompressing theedgehub-suite_x.x.x_linux-[arch].tar.gzfile).
The installer will automatically copy the token.cfg file to the EdgeHub agent installation directory.
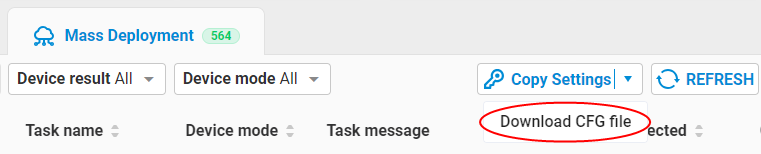
Downloading the CFG File:
The token.cfg file can also be downloaded directly from Mass Deployment:
- Click "[Copy Settings]".
- Select "[Download CFG file]".
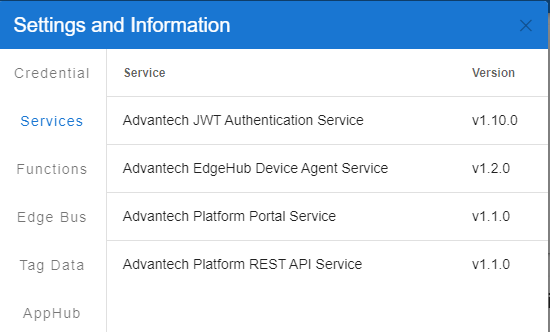
Services
(since 1.0.1)
This displays the services related to EdgeHub and their respective versions.
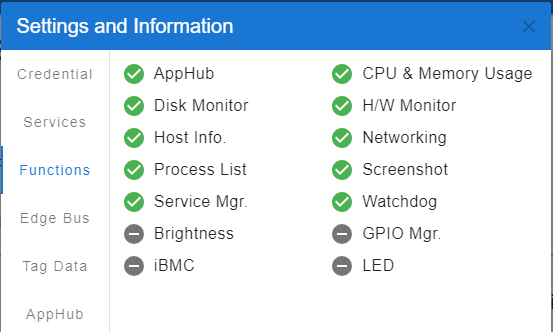
Functions
(since 1.0.1)
The capabilities of the device are displayed.
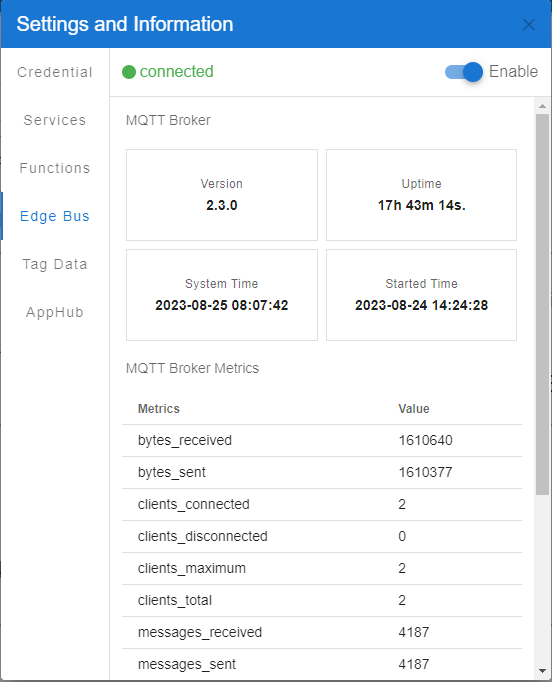
Edge Bus
(since 1.0.1)
This feature displays details about the EdgeBus (Embedded Broker) and allows turning it on or off.
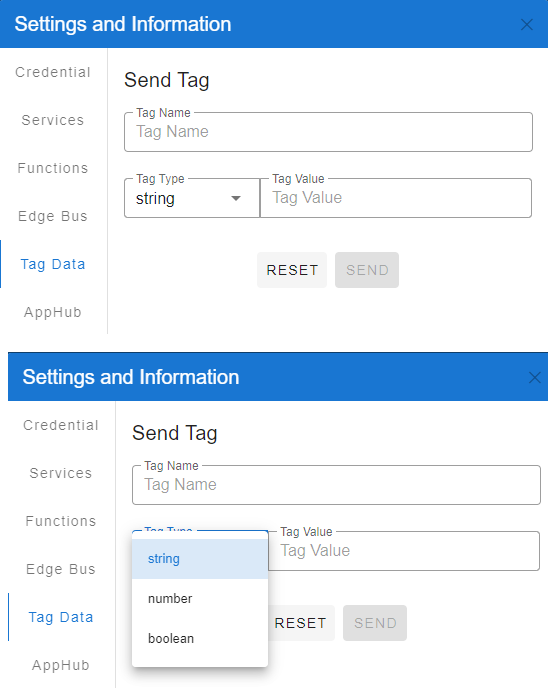
Tag Data
(since 1.0.1)
You could send tag data to EdgeHub.
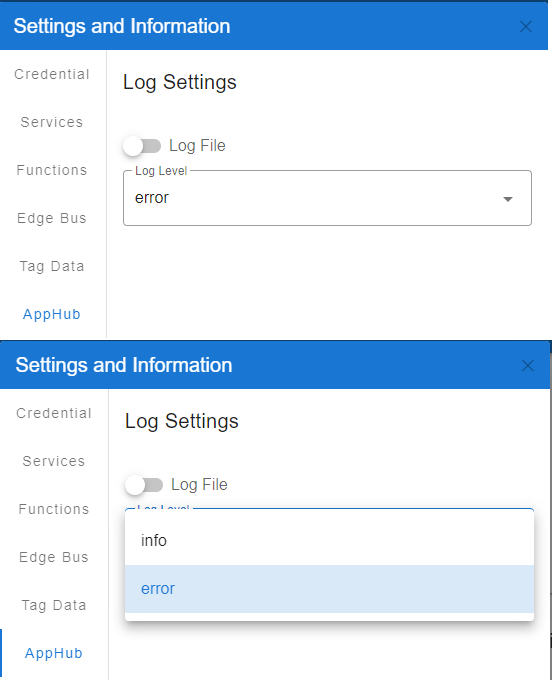
AppHub Log Settings
(since 1.0.1)
You could change AppHub's log settings.
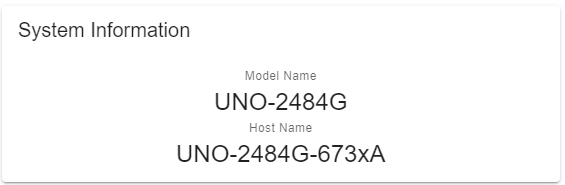
System Information
Device Name from the BIOS.
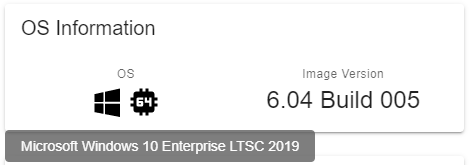
OS Information
OS type (Windows, Linux), architecture (x86, x86_64, armv7l, arm64), and the Embedded Image version (if available).

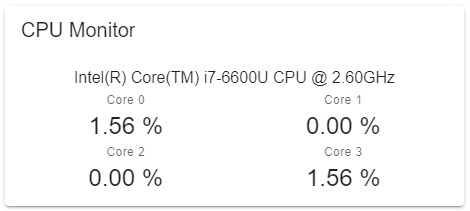
CPU Monitor
CPU Information and Usage Monitoring
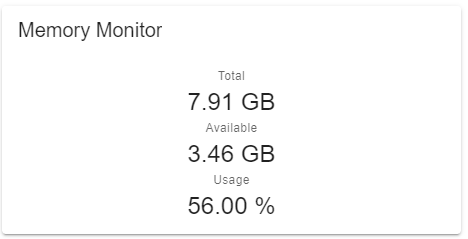
Memory Monitor
Memory Usage Monitoring
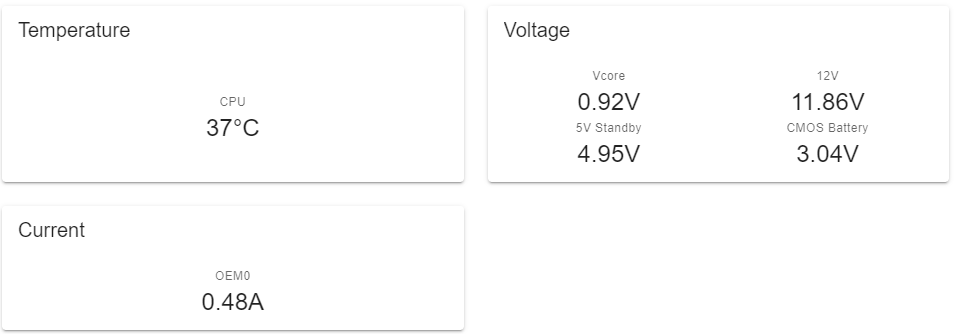
HW Monitor
Monitoring Temperature, Voltage, Current, and FAN speed.
Disk Monitor
The Disk Monitor provides an overview of disks, including model name, size, partition list, usage, and S.M.A.R.T. information (if available). The U.I. will refresh if there is any change (inserted, removed).
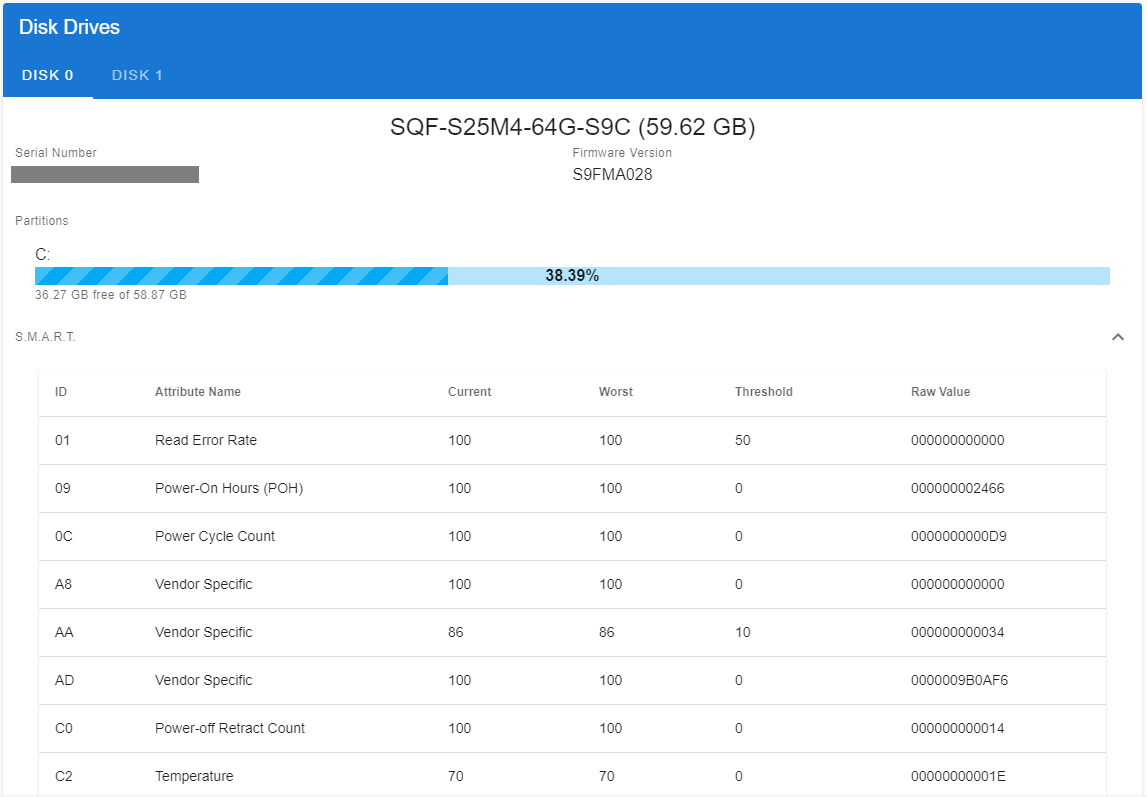
Disk Selection
Click on the DISK tab to switch the disk selection.

General Information
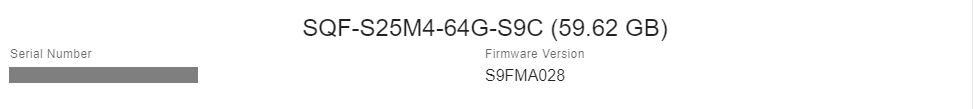
Partitions and Usage information

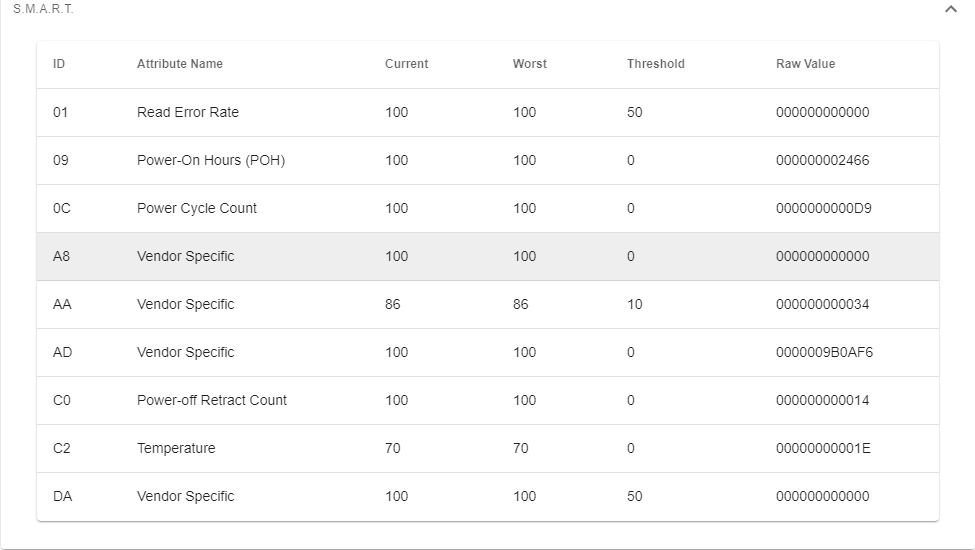
S.M.A.R.T. Information
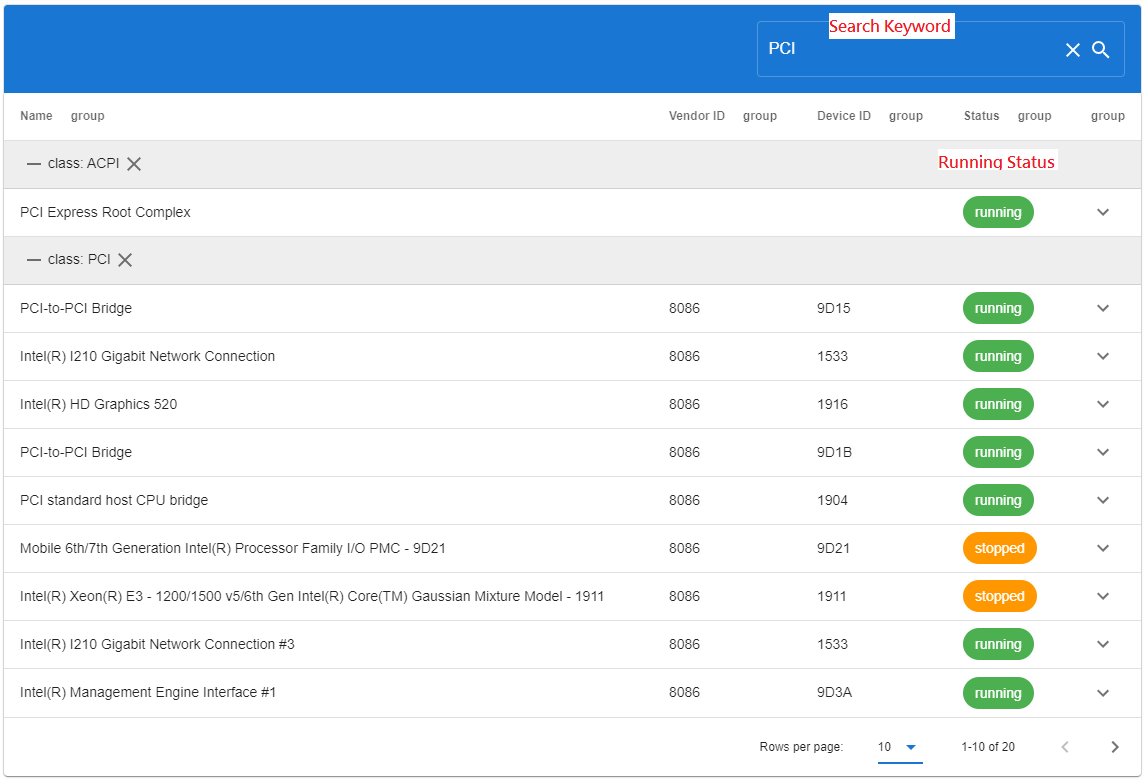
System Devices
It allows users to view the hardware attached to the computer and monitor the running status. (Windows only)
You can enter the keyword to search the hardware you want, e.g., PCI, USB ...etc.
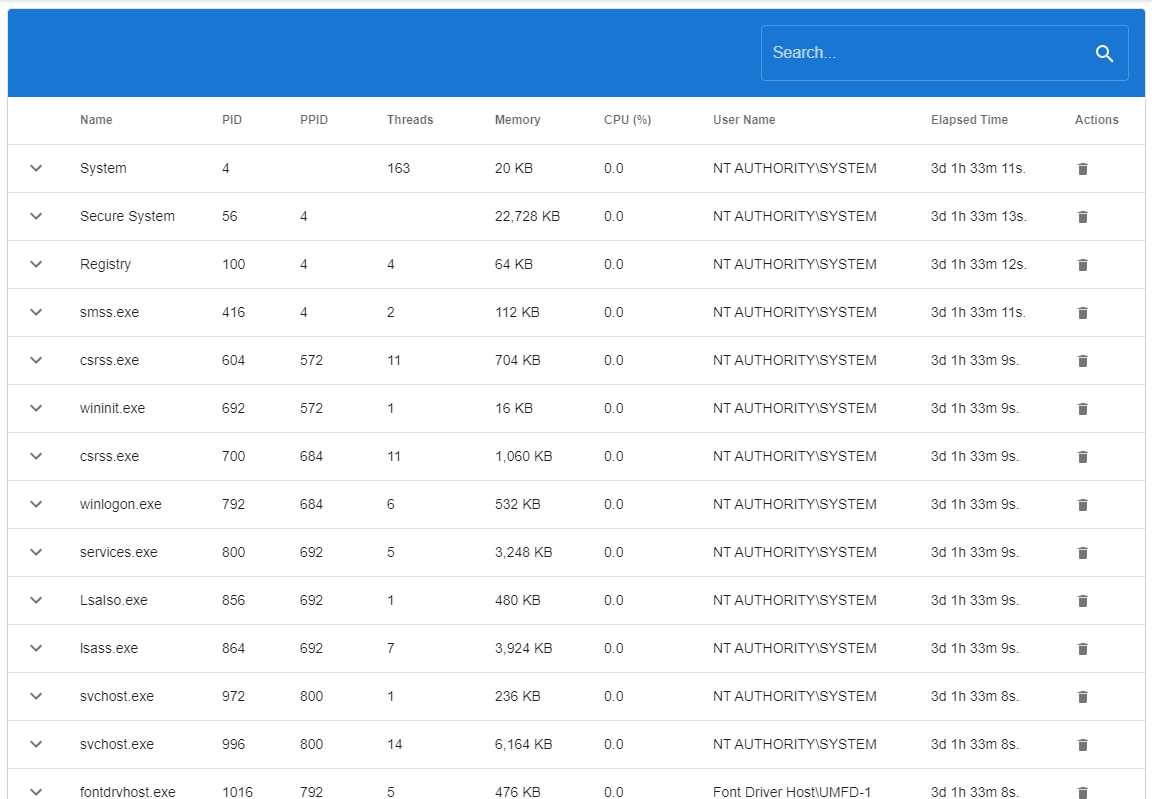
Process Monitor
The Process Monitor provides information about running processes. You could search or kill the running process.
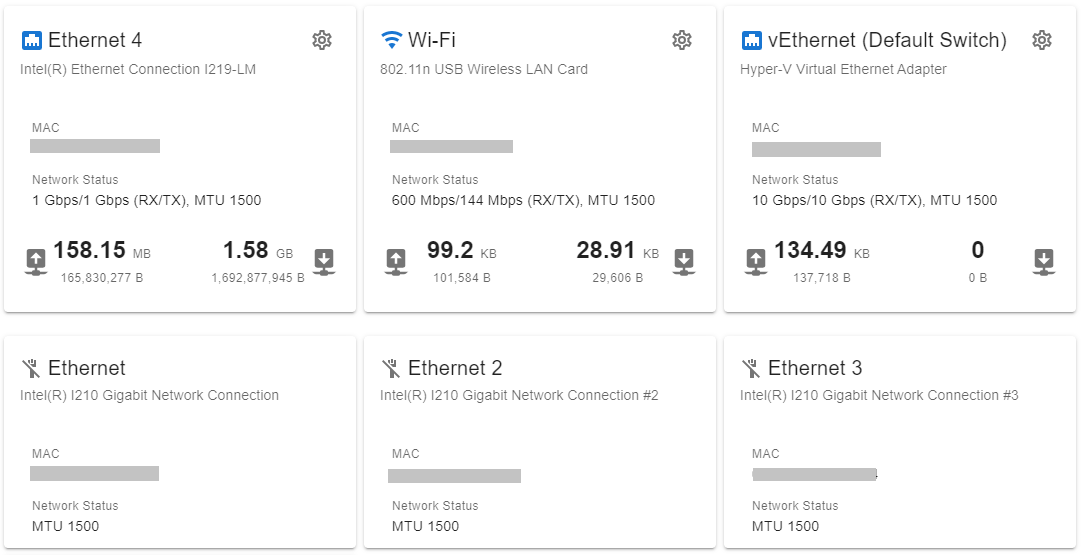
Networking
Users can monitor network adapters, Wi-Fi management, and network interface priority (metric) settings.
Interfaces
It provides an overview of the device's network interfaces.
Interface Information
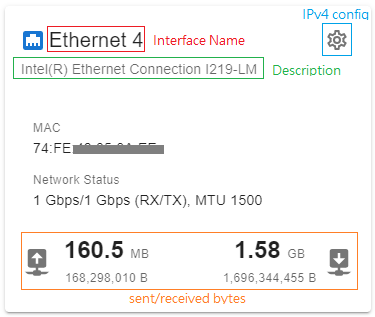
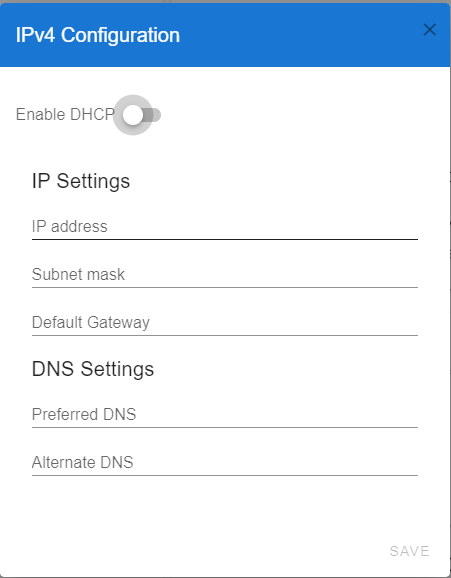
IPv4 Configuraiton
-
DHCP
Turn on the Enable DHCP switch button to enable the DHCP.
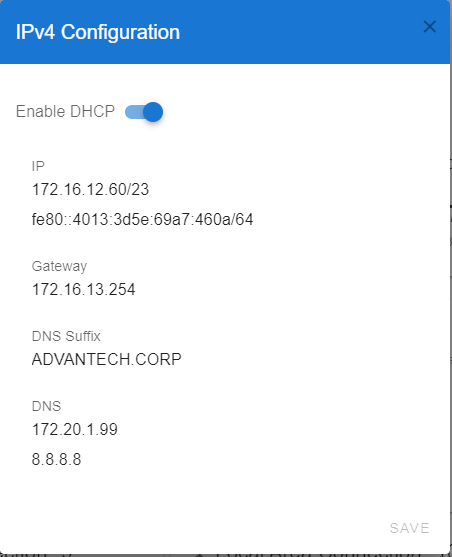
-
Static IP
Turns off the Enable DHCP switch button and sets the IPv4 configuration with static IP and DNS. If a static IP is specified, then DNS must also be specified.
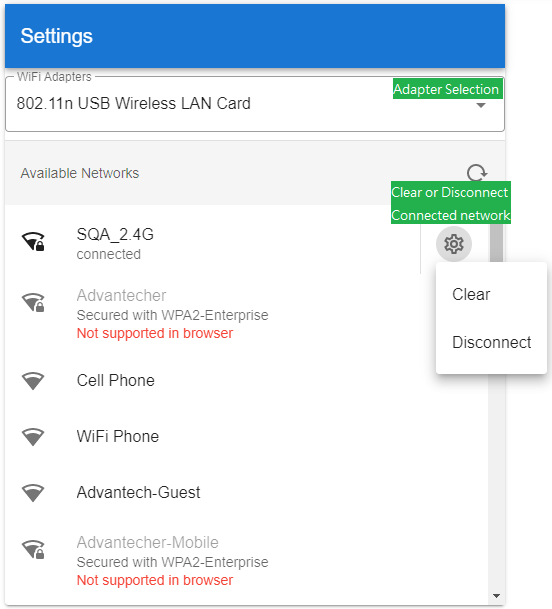
Wi-Fi
You can select the Wi-Fi adapter from the WiFi Adapters list, click on an Available Networks item to connect to the Wi-Fi network, click on the connected network to disconnect, or click on the Setting (Cog Icon) button of the connected network to disconnect or clear the Wi-Fi network profile.
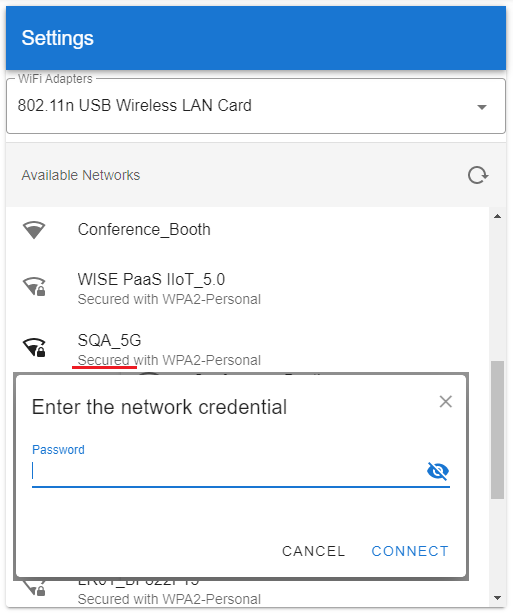
If the selected network is secured, enter the network credential to connect to the Wi-Fi network.
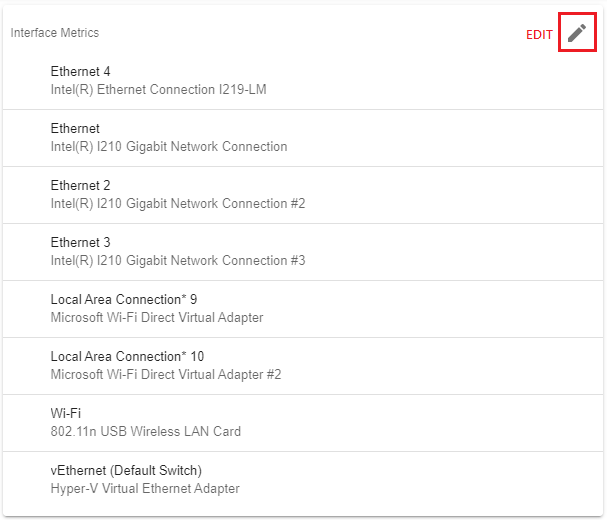
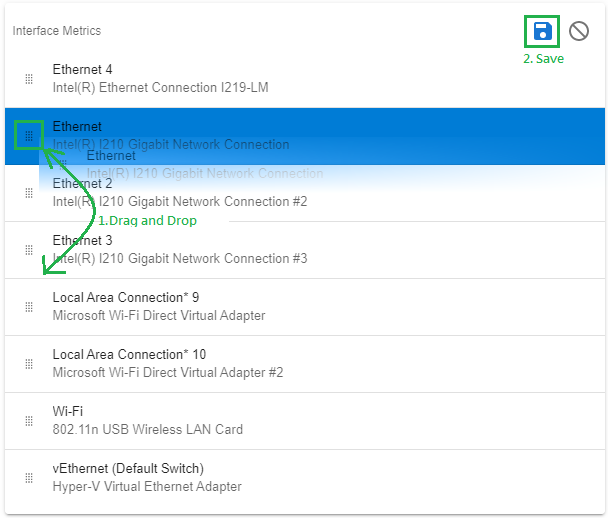
Interface Routing
The Interface Routing provides an overview of the Interface Metrics. You can click the EDIT button to change the sequence of the network interface route.
Edit Interface Route
You can drag and drop the interface handle to change the interface priority (metric) and then click the SAVE button to save the changes.
Service
(since 1.0.1)
The Service page lists all the system services (Windows Services, Linux Services) and allows you to start, stop, and restart services.
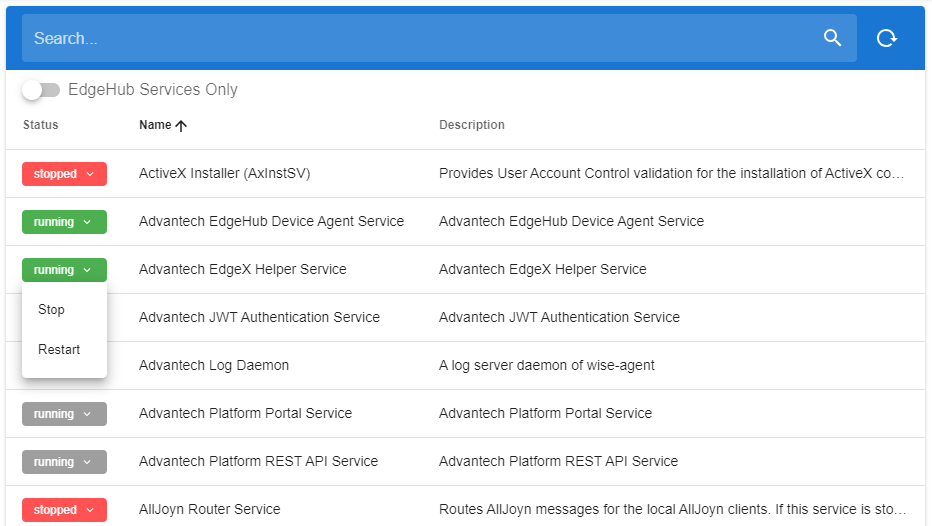
You can click on the status dropdown button to configure the service. The running service's background color is green, and the stopped service is red. If the service is not allowed to configure, it will be grey, and the button will be disabled.

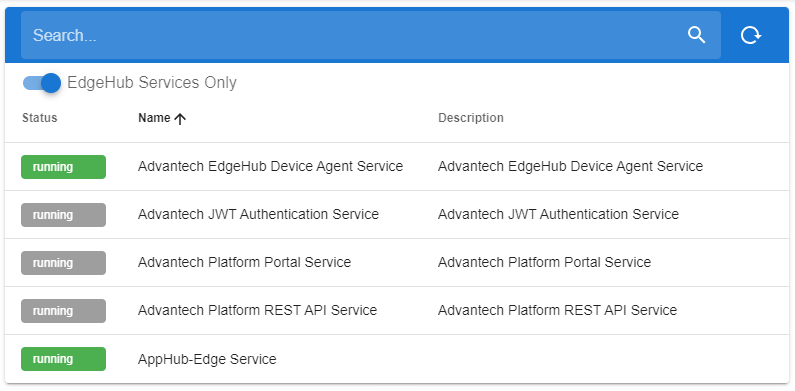
You can only turn on the "EdgeHub Services Only" switch to list the EdgeHub-related services. The Platform Portal-related services are disabled and not allowed to configure.
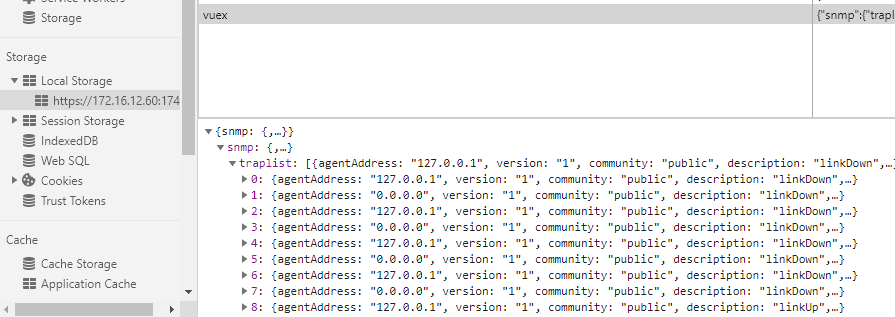
Trap Receiver
If you stay on this page, you could receive the SNMP Traps and the Variable Bindings.
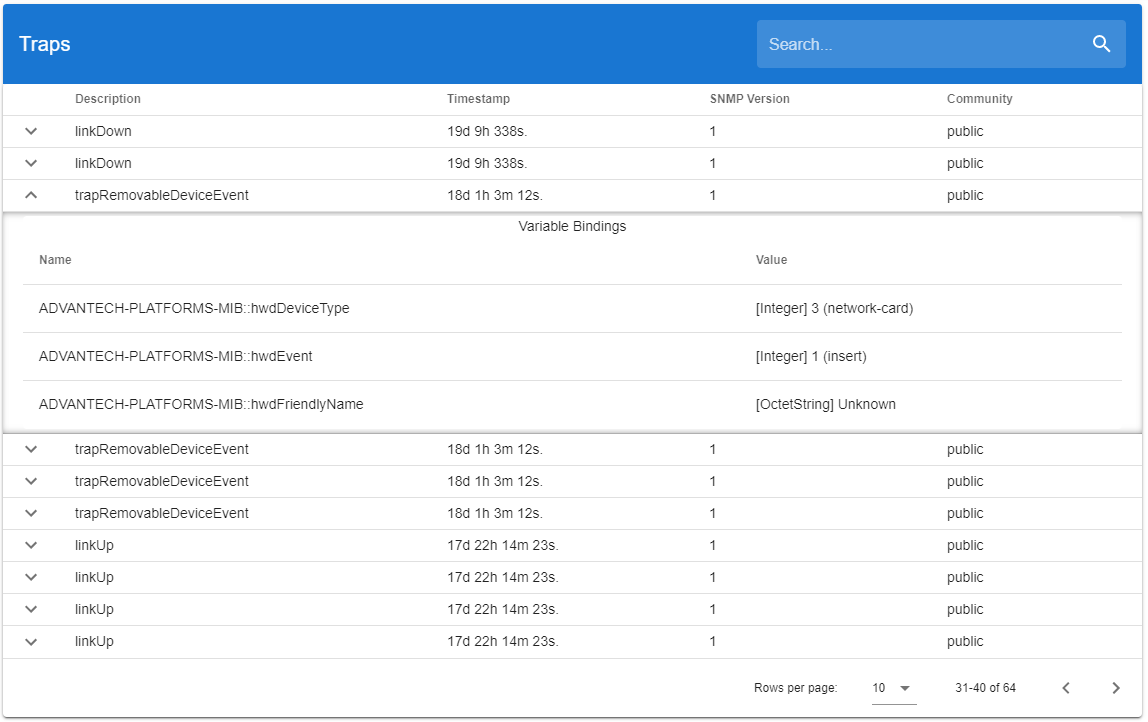
The data will be stored in the browser's LocalStorage.
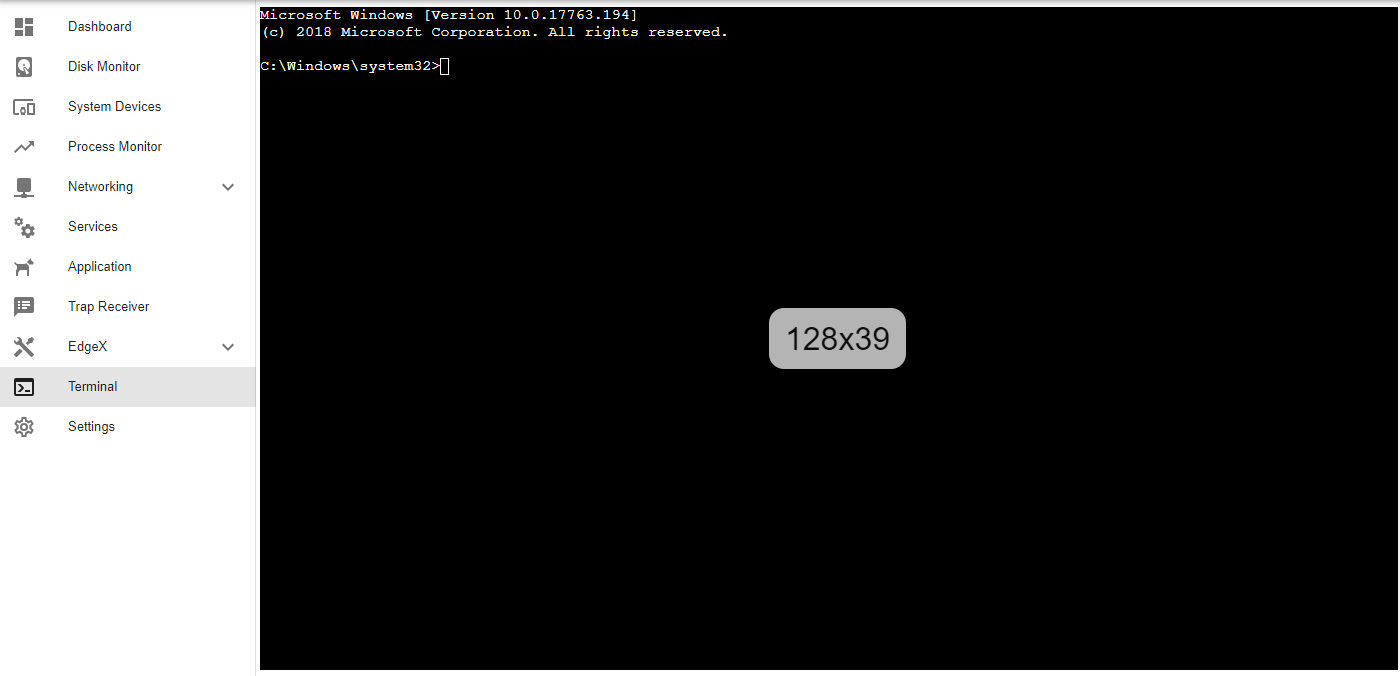
Terminal
(since version 1.0.1)
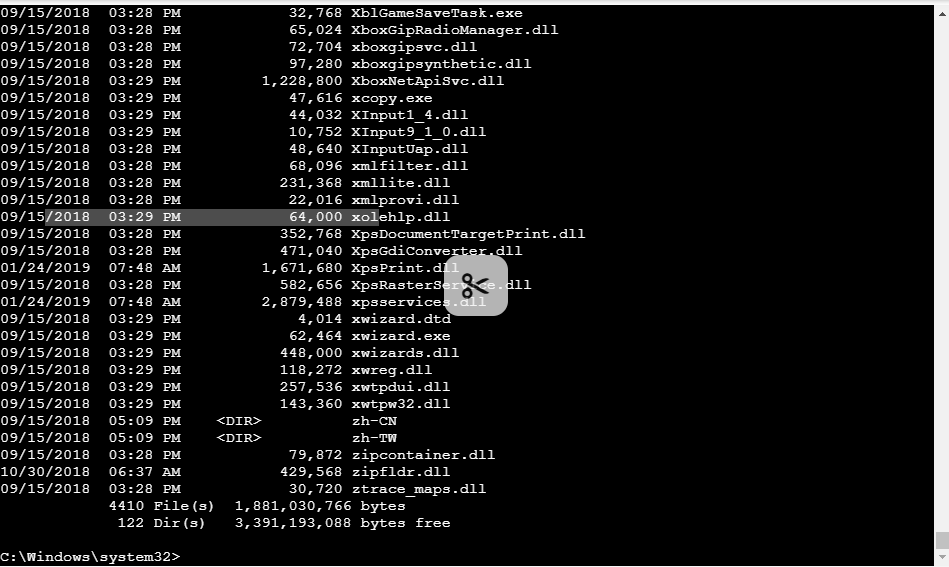
Introducing a user-friendly command-line utility that facilitates terminal sharing. This tool transforms your terminal into a web application using xterm.js technology.
It will copy the text you selected from the terminal to the clipboard.
Remote Desktop
It is designed to be intuitive and easy to use, allowing users to connect quickly, control, and interact with remote desktops directly from their web browser.
UI Elements
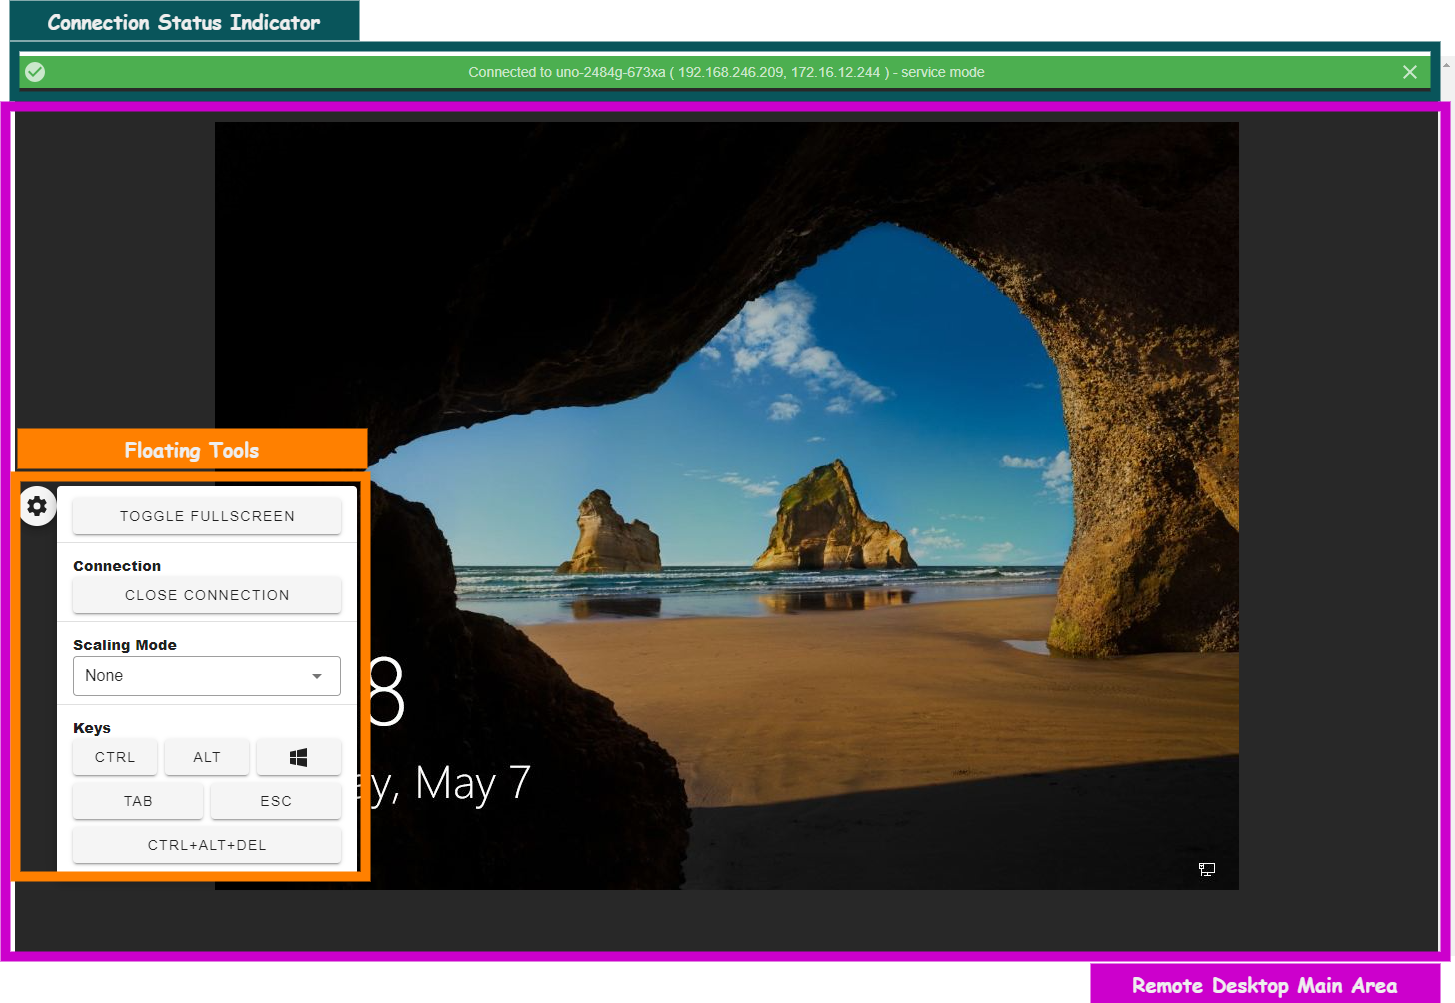 Remote Desktop Connection User Interface
The UI for a remote desktop connection can be divided into three main sections:
-
Connection Status Indicator: The top section of the UI contains the connection status indicator. This indicator displays the current status of the remote desktop connection, such as Connecting, Connected, Disconnected, or Error Message.
-
Remote Desktop Main Area: The main area of the UI displays the remote desktop. This area allows users to view and interact with the remote desktop as if sitting in front of the physical computer.
-
Floating Tools
- Toggle Fullscreen This button allows users to switch the main area to enter or leave the fullscreen mode.
- Connection: This button allows users to connect to or disconnect from the remote desktop.
- Scaling Mode: This allows users to select the scaling mode of the main area, including Remote Scaling, Local Scaling, or None. (Note: not all platforms support Remote Scaling)
- Keys: This tool allows users to send keyboard combination keys to the remote desktop.
Settings
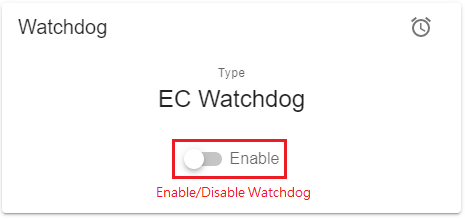
Watchdog Control
Effortlessly activate or deactivate the Watchdog feature by toggling the switch button labeled Enable. This provides you with a convenient way to manage the Watchdog functionality.
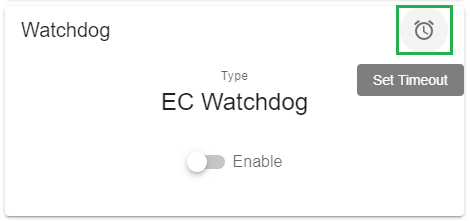
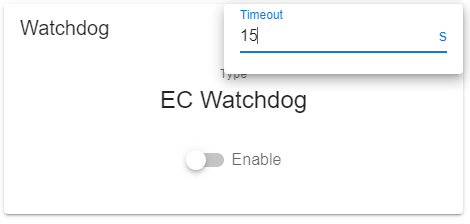
Configuring Watchdog Timeout
To define the duration of the Watchdog timeout, click the "Set Timeout" button and specify the desired timeout value.
Watchdog Enabled

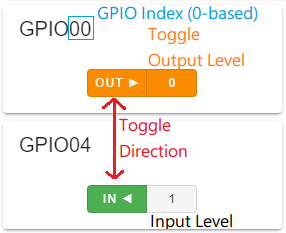
GPIO
Brightness

Using the intuitive slider, you can easily fine-tune the brightness of your display. Slide it to your desired level, and the new brightness value will be applied once you release the mouse button.
