Dashboard
This function provides a friendly UI for user to quickly create and manage dashboards of a group. EdgeHub integrates WISE-IoTSuite Dashboard's APIs to accomplish the following funcational mapping:
- Tenant = Dashboard Org
- Tenant user = Dashboard Org user
- Group of a tenant = Folder of a Dashboard Org
- Group user = User that allow to access the Folder of a Dashboard Org
- Dashboard of a group = Dashboard in the Folder of a Dashboard Org
User can access this function from Command Center -> Dashboard Tab
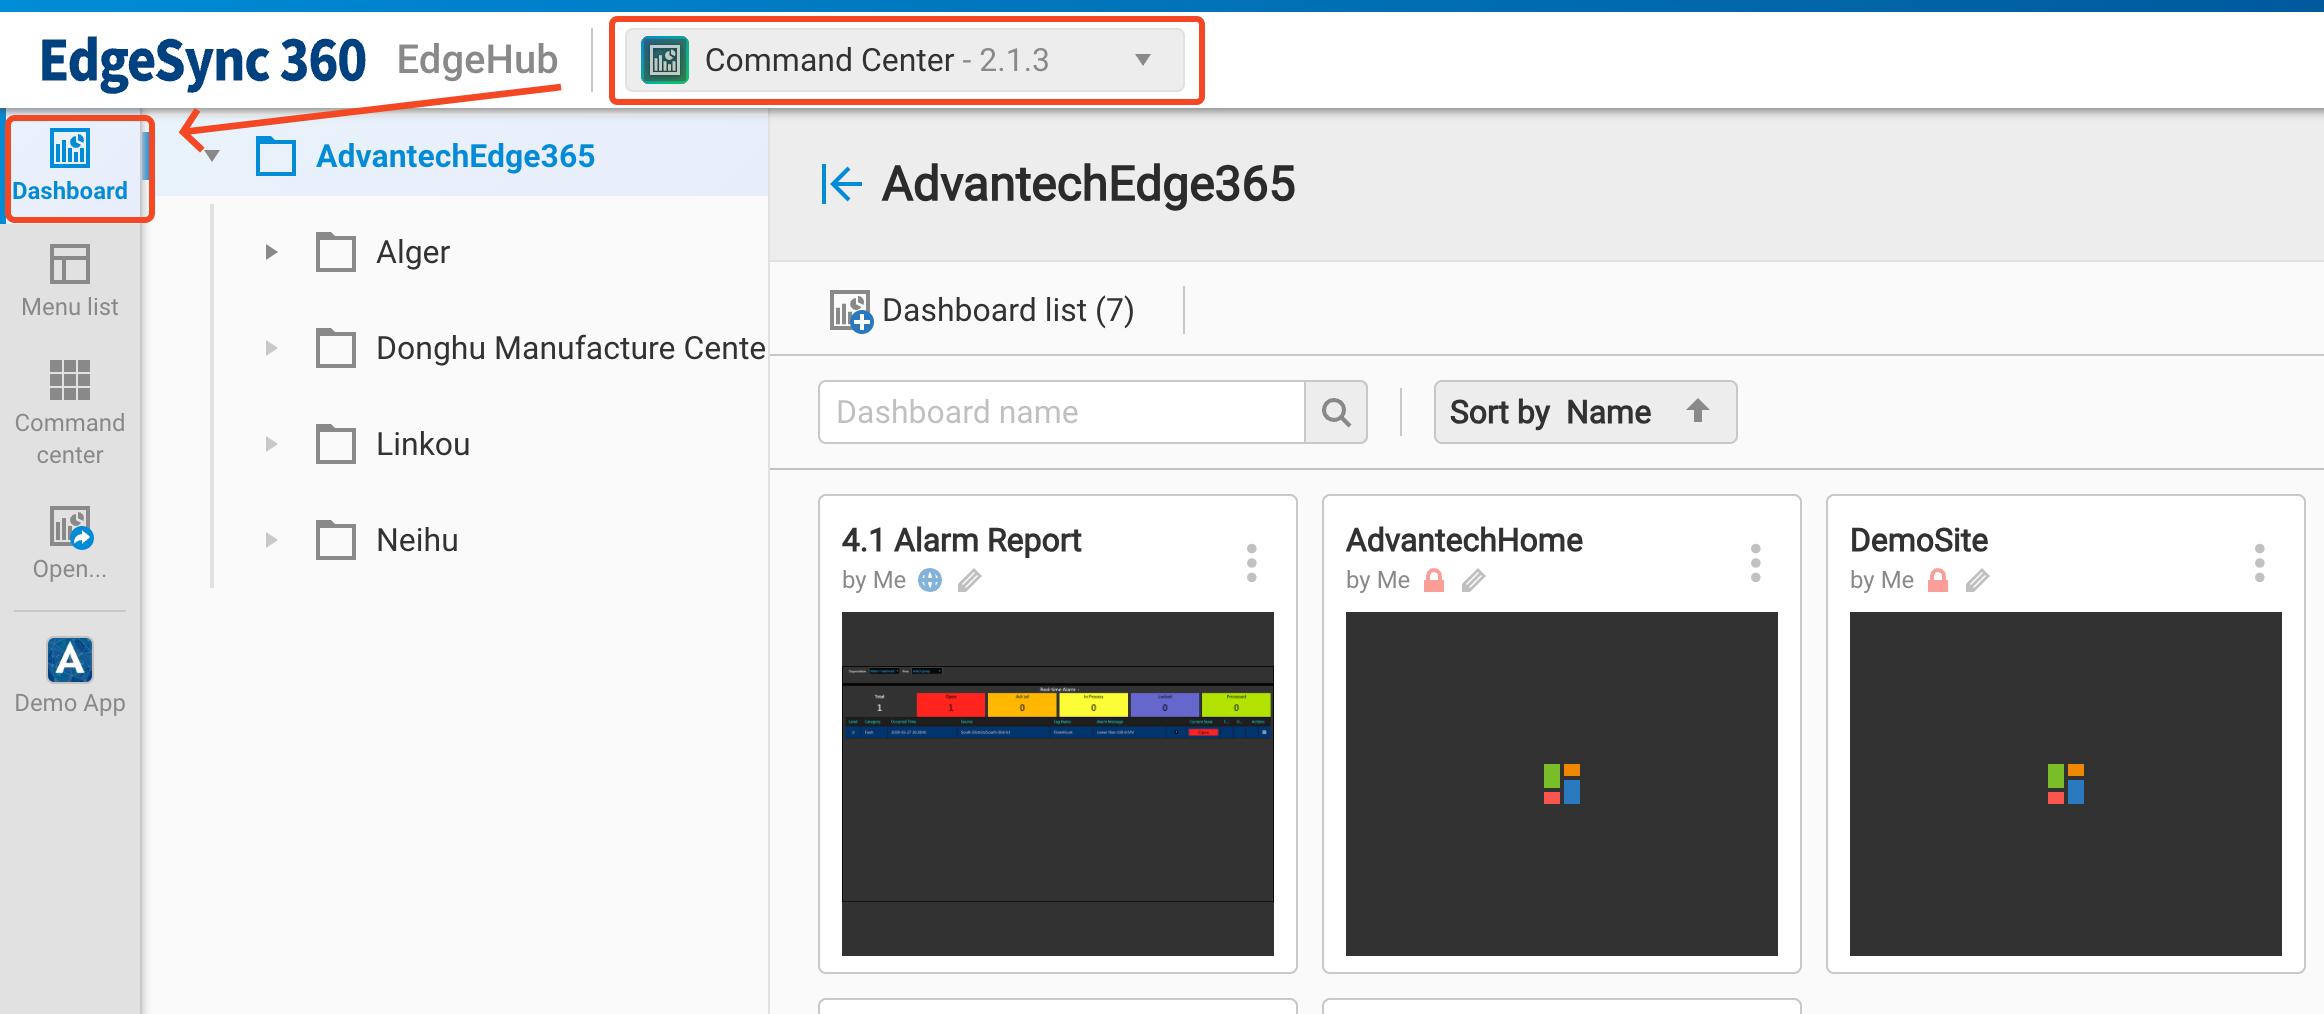
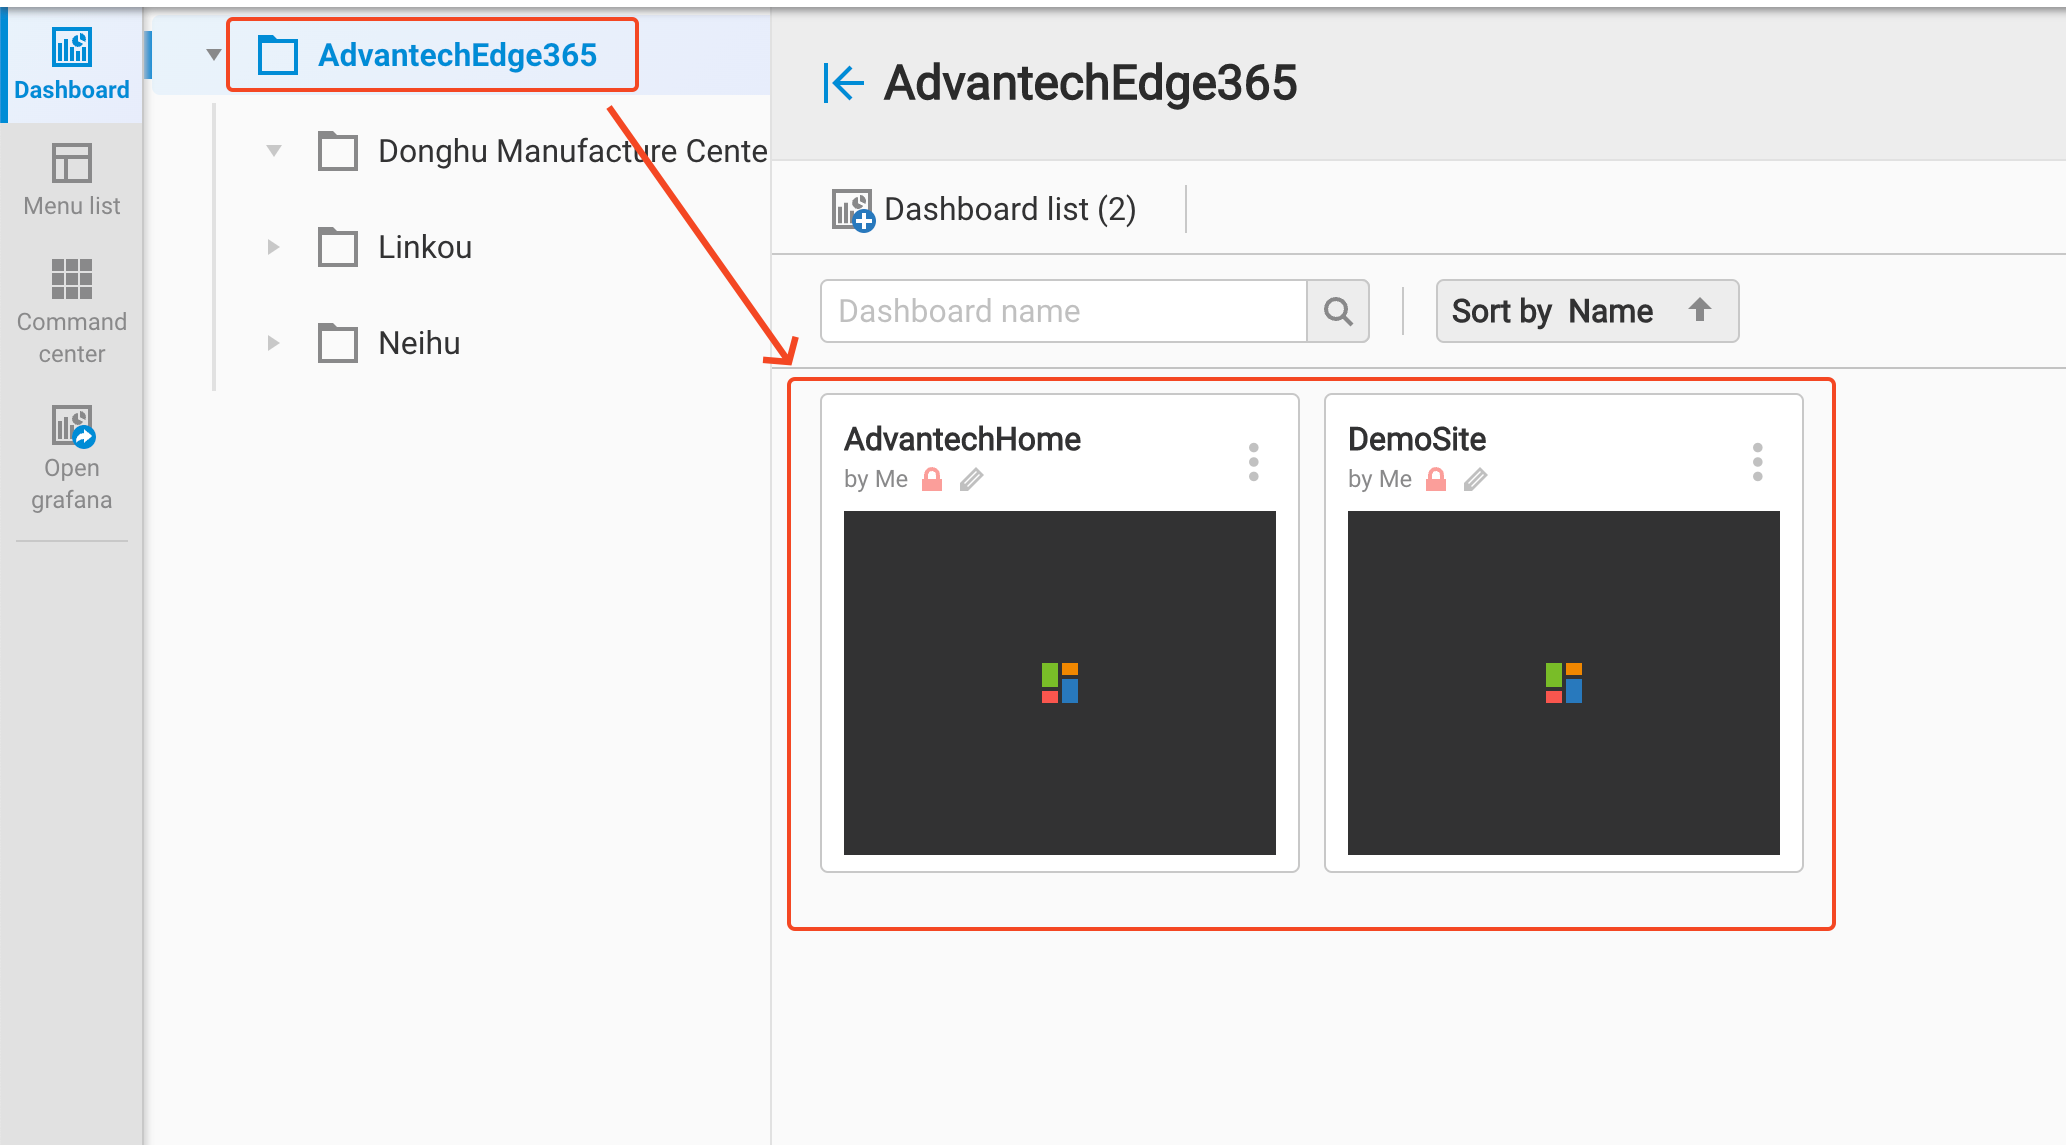
Click a Group to view the Dashboards of this group
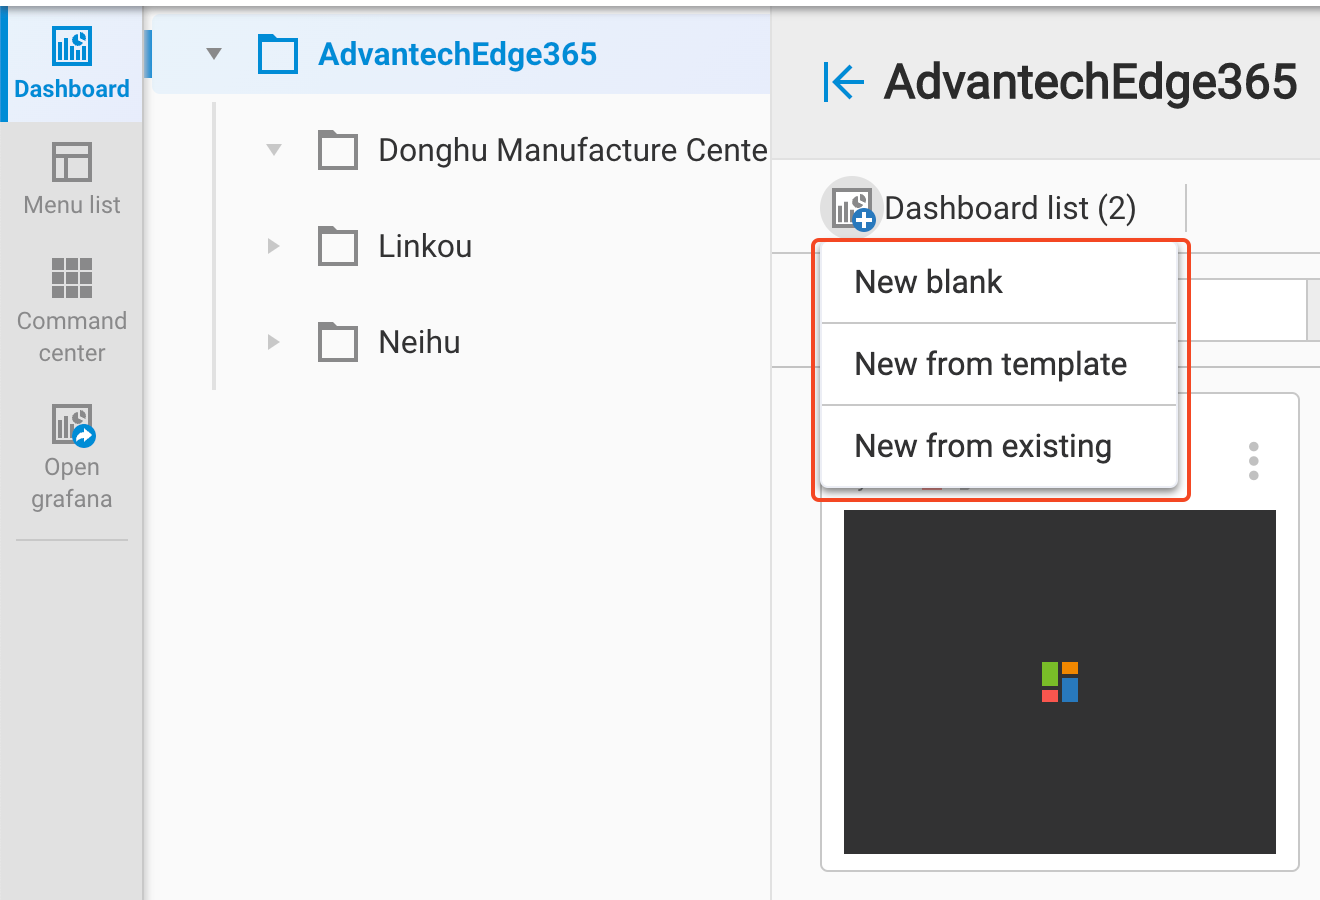
Click + to create a new dashboard by the following methods:
- New blank
- Create a new one from a blank dashboard
- New from template
- Create a new one from pre-build templates
- New from existing
- Create a new one from an existing dashboard
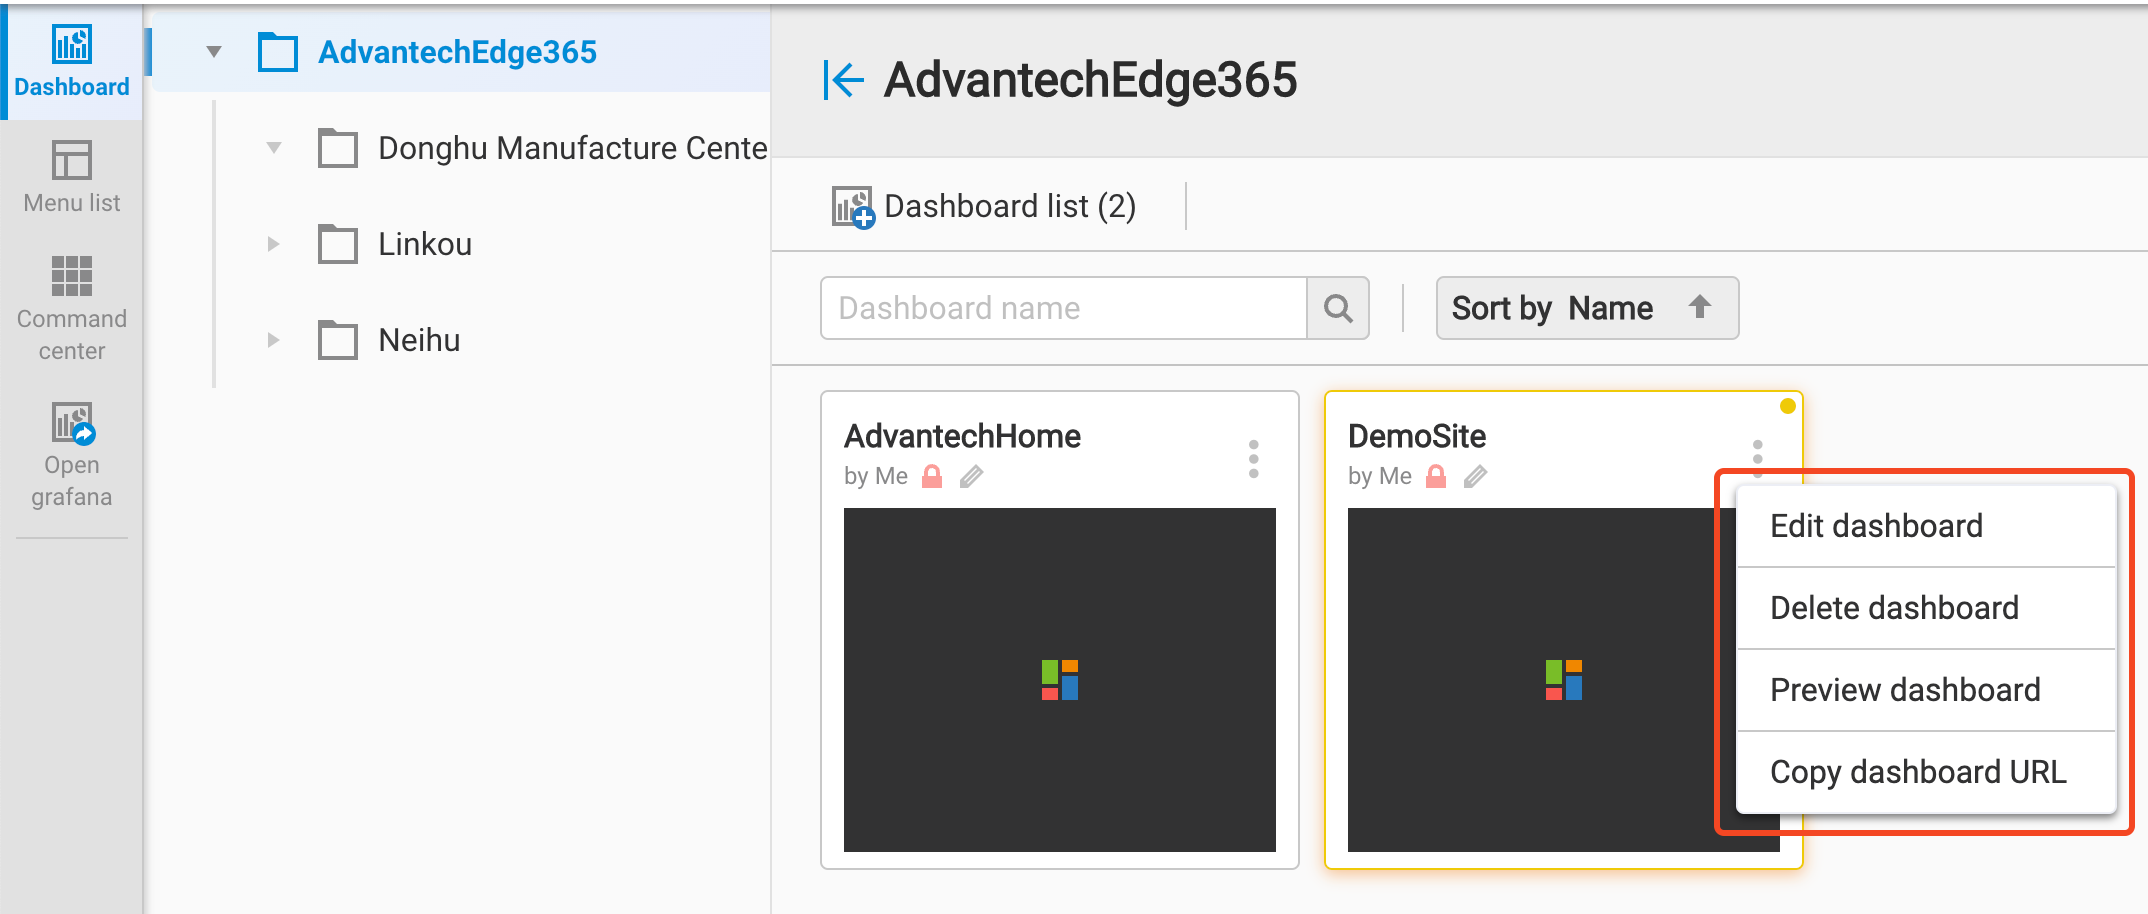
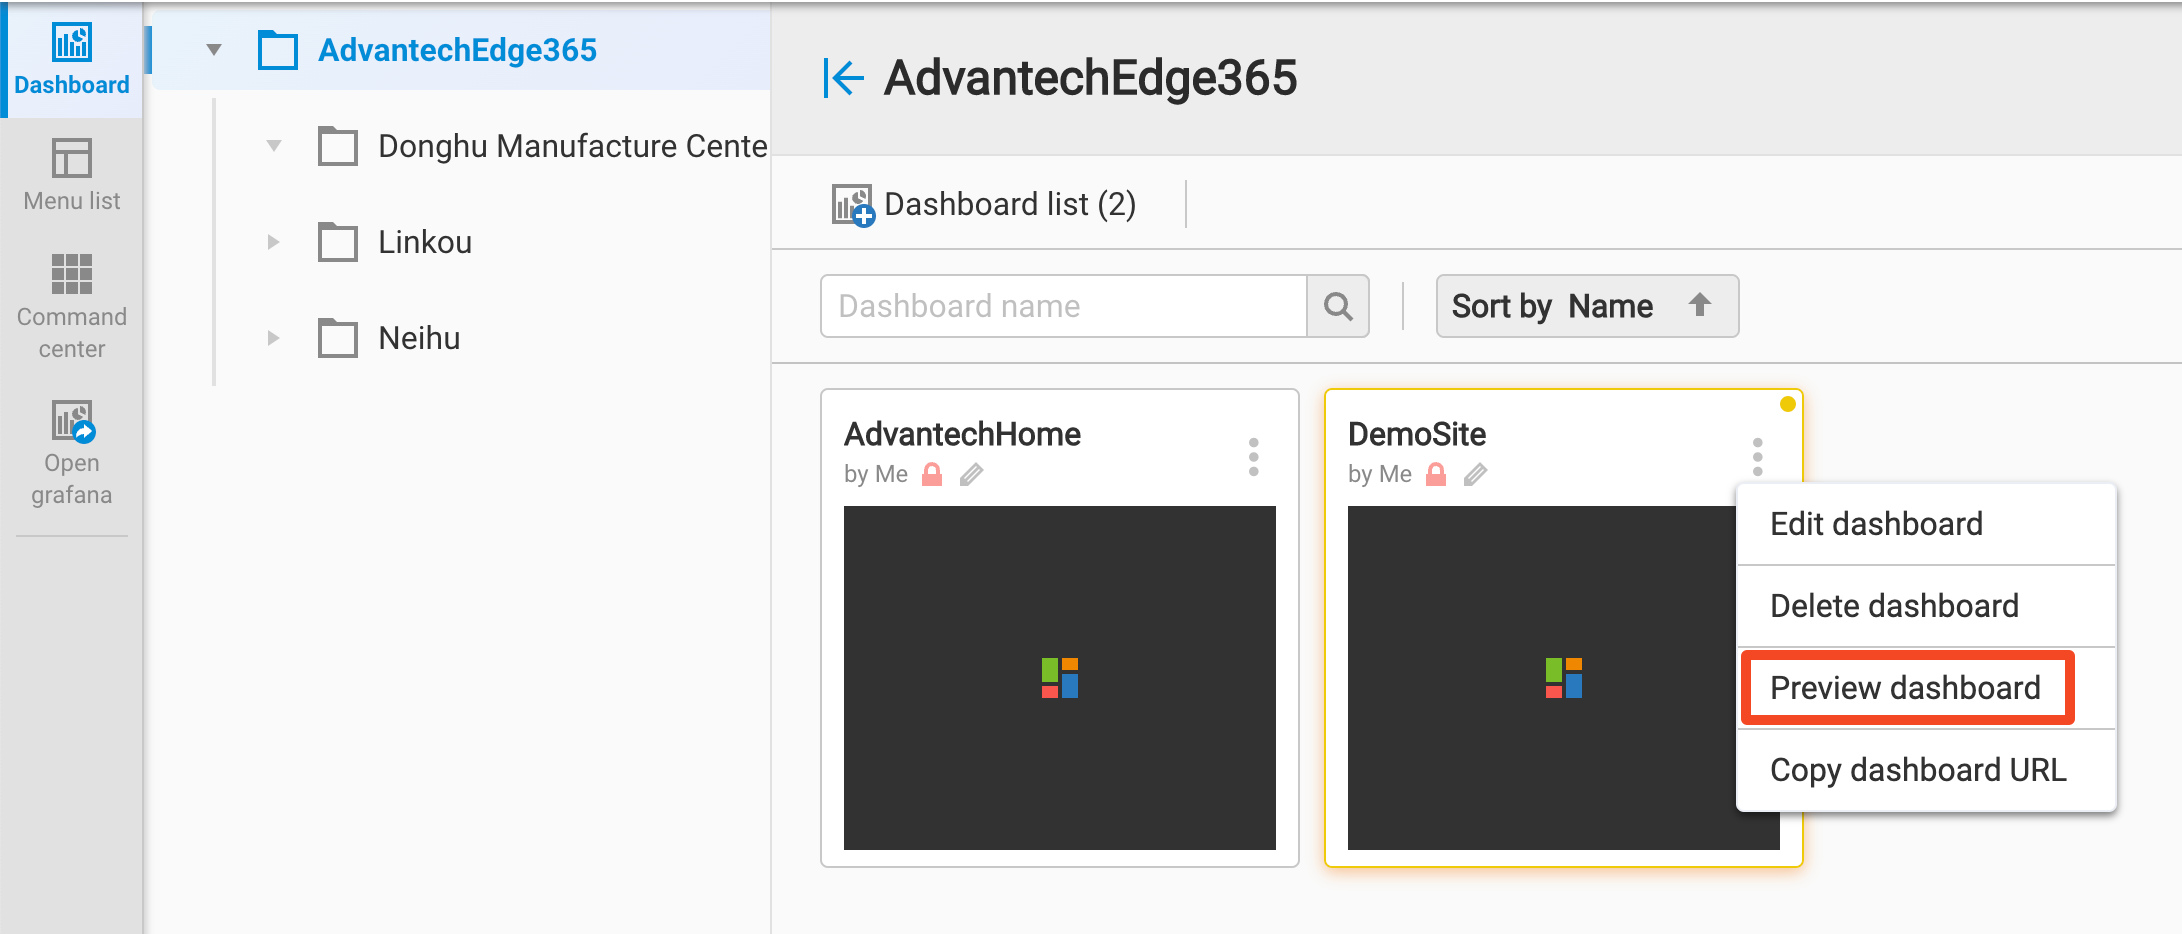
You can manage each dashboard by click the top right icon of the dashboard card to access the following functions:
- Edit dashboard
- Edit this dashboard by Dashboard Wizard UI
- Delete dashboard
- Delete this dashboard
- Preview dashboard
- Open WISE-IoTSuite Dashboard to preview this dashboard
- Copy dashboard URL
- Copy the URL of this dashboard
New blank / Edit dashboard by Dashboard Wizard
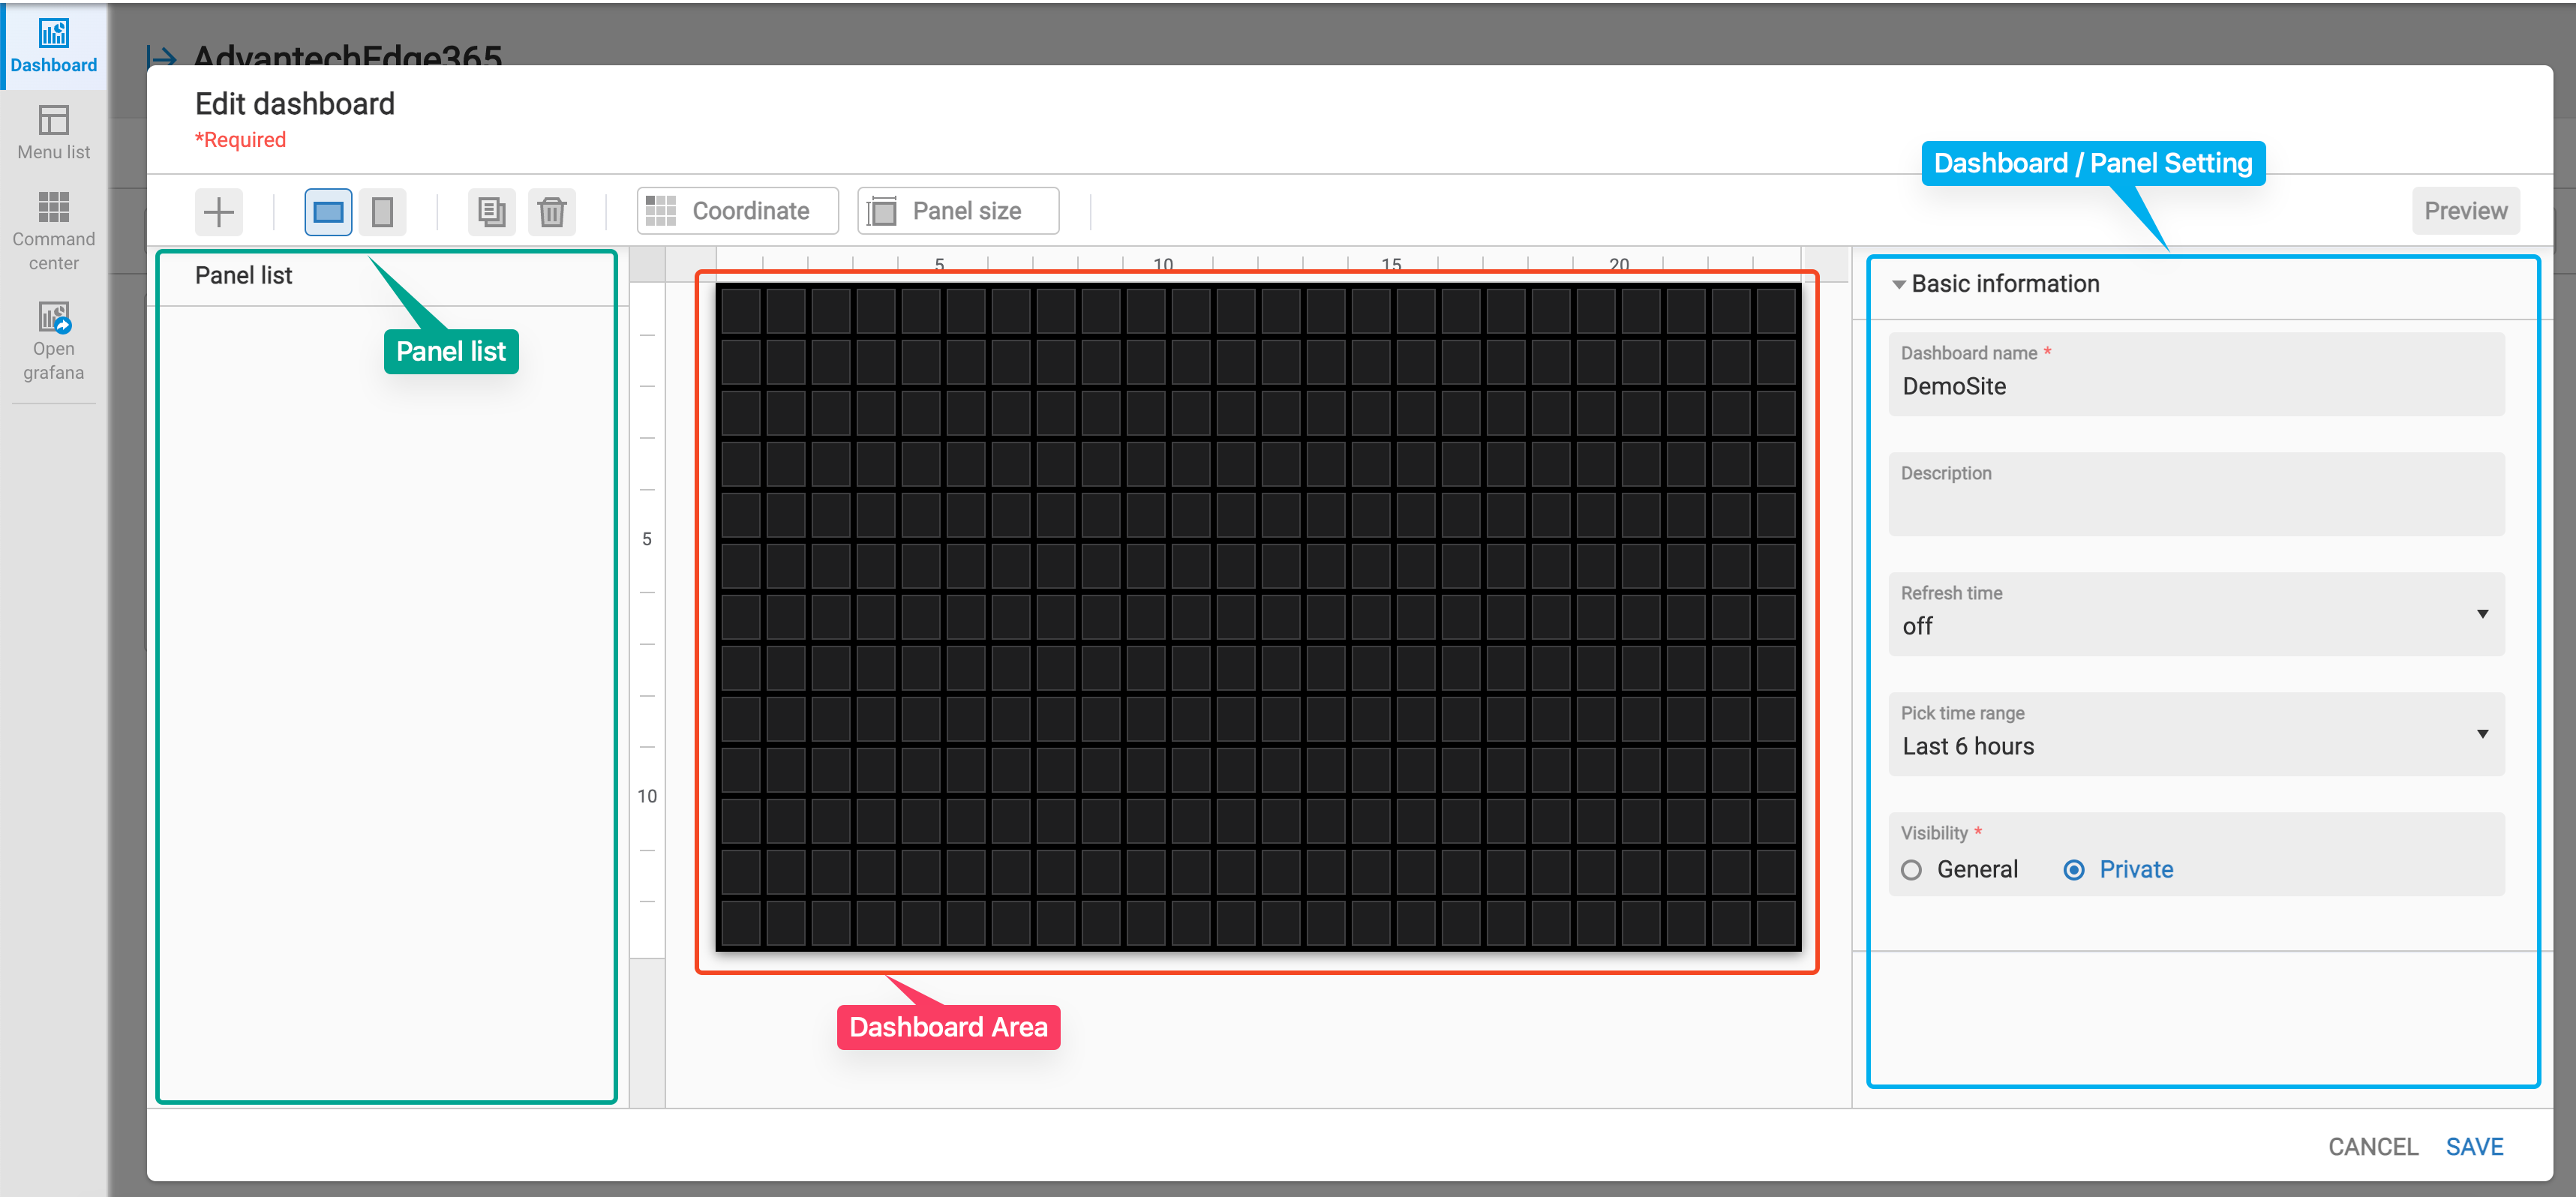
When user start to create a dashboard by New blank, or Edit a dashboard, EdgeHub UI will pop-up a dialog with Dashboard Wizard functionalities. It can be roughly divided into three blocks
- Panel list
- list the panel of this dashboard
- Dashboard Area
- The edit area that let you to drag and drop the panel and plan your dashboard layout.
- Dashboard / Panel Setting
- List the dashboard setting and the selected panel's setting
- List the dashboard setting and the selected panel's setting
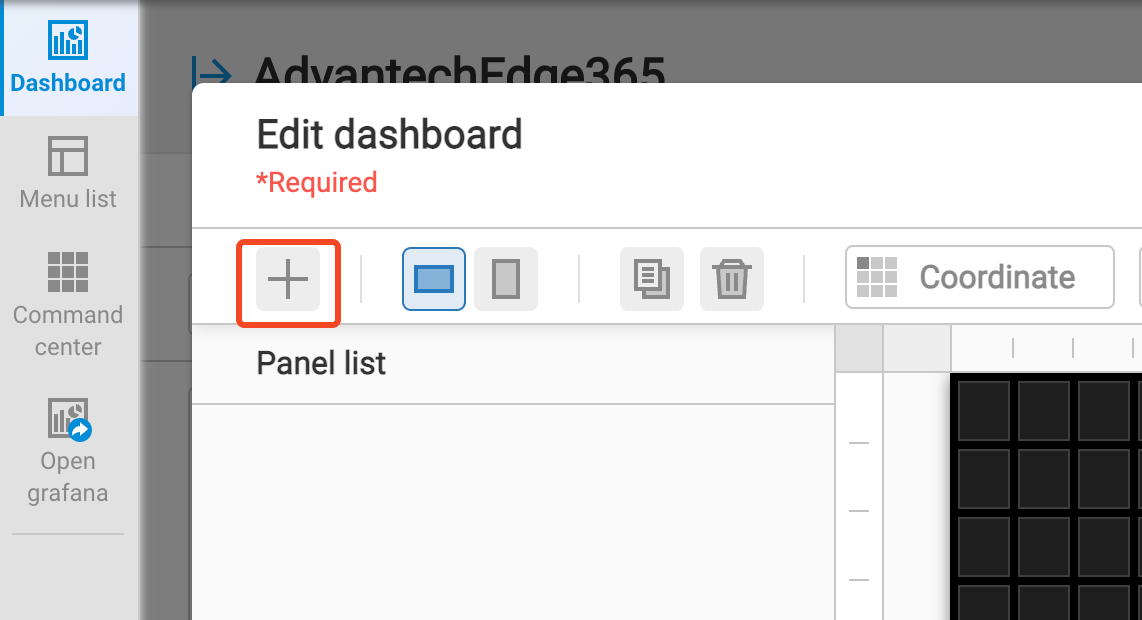
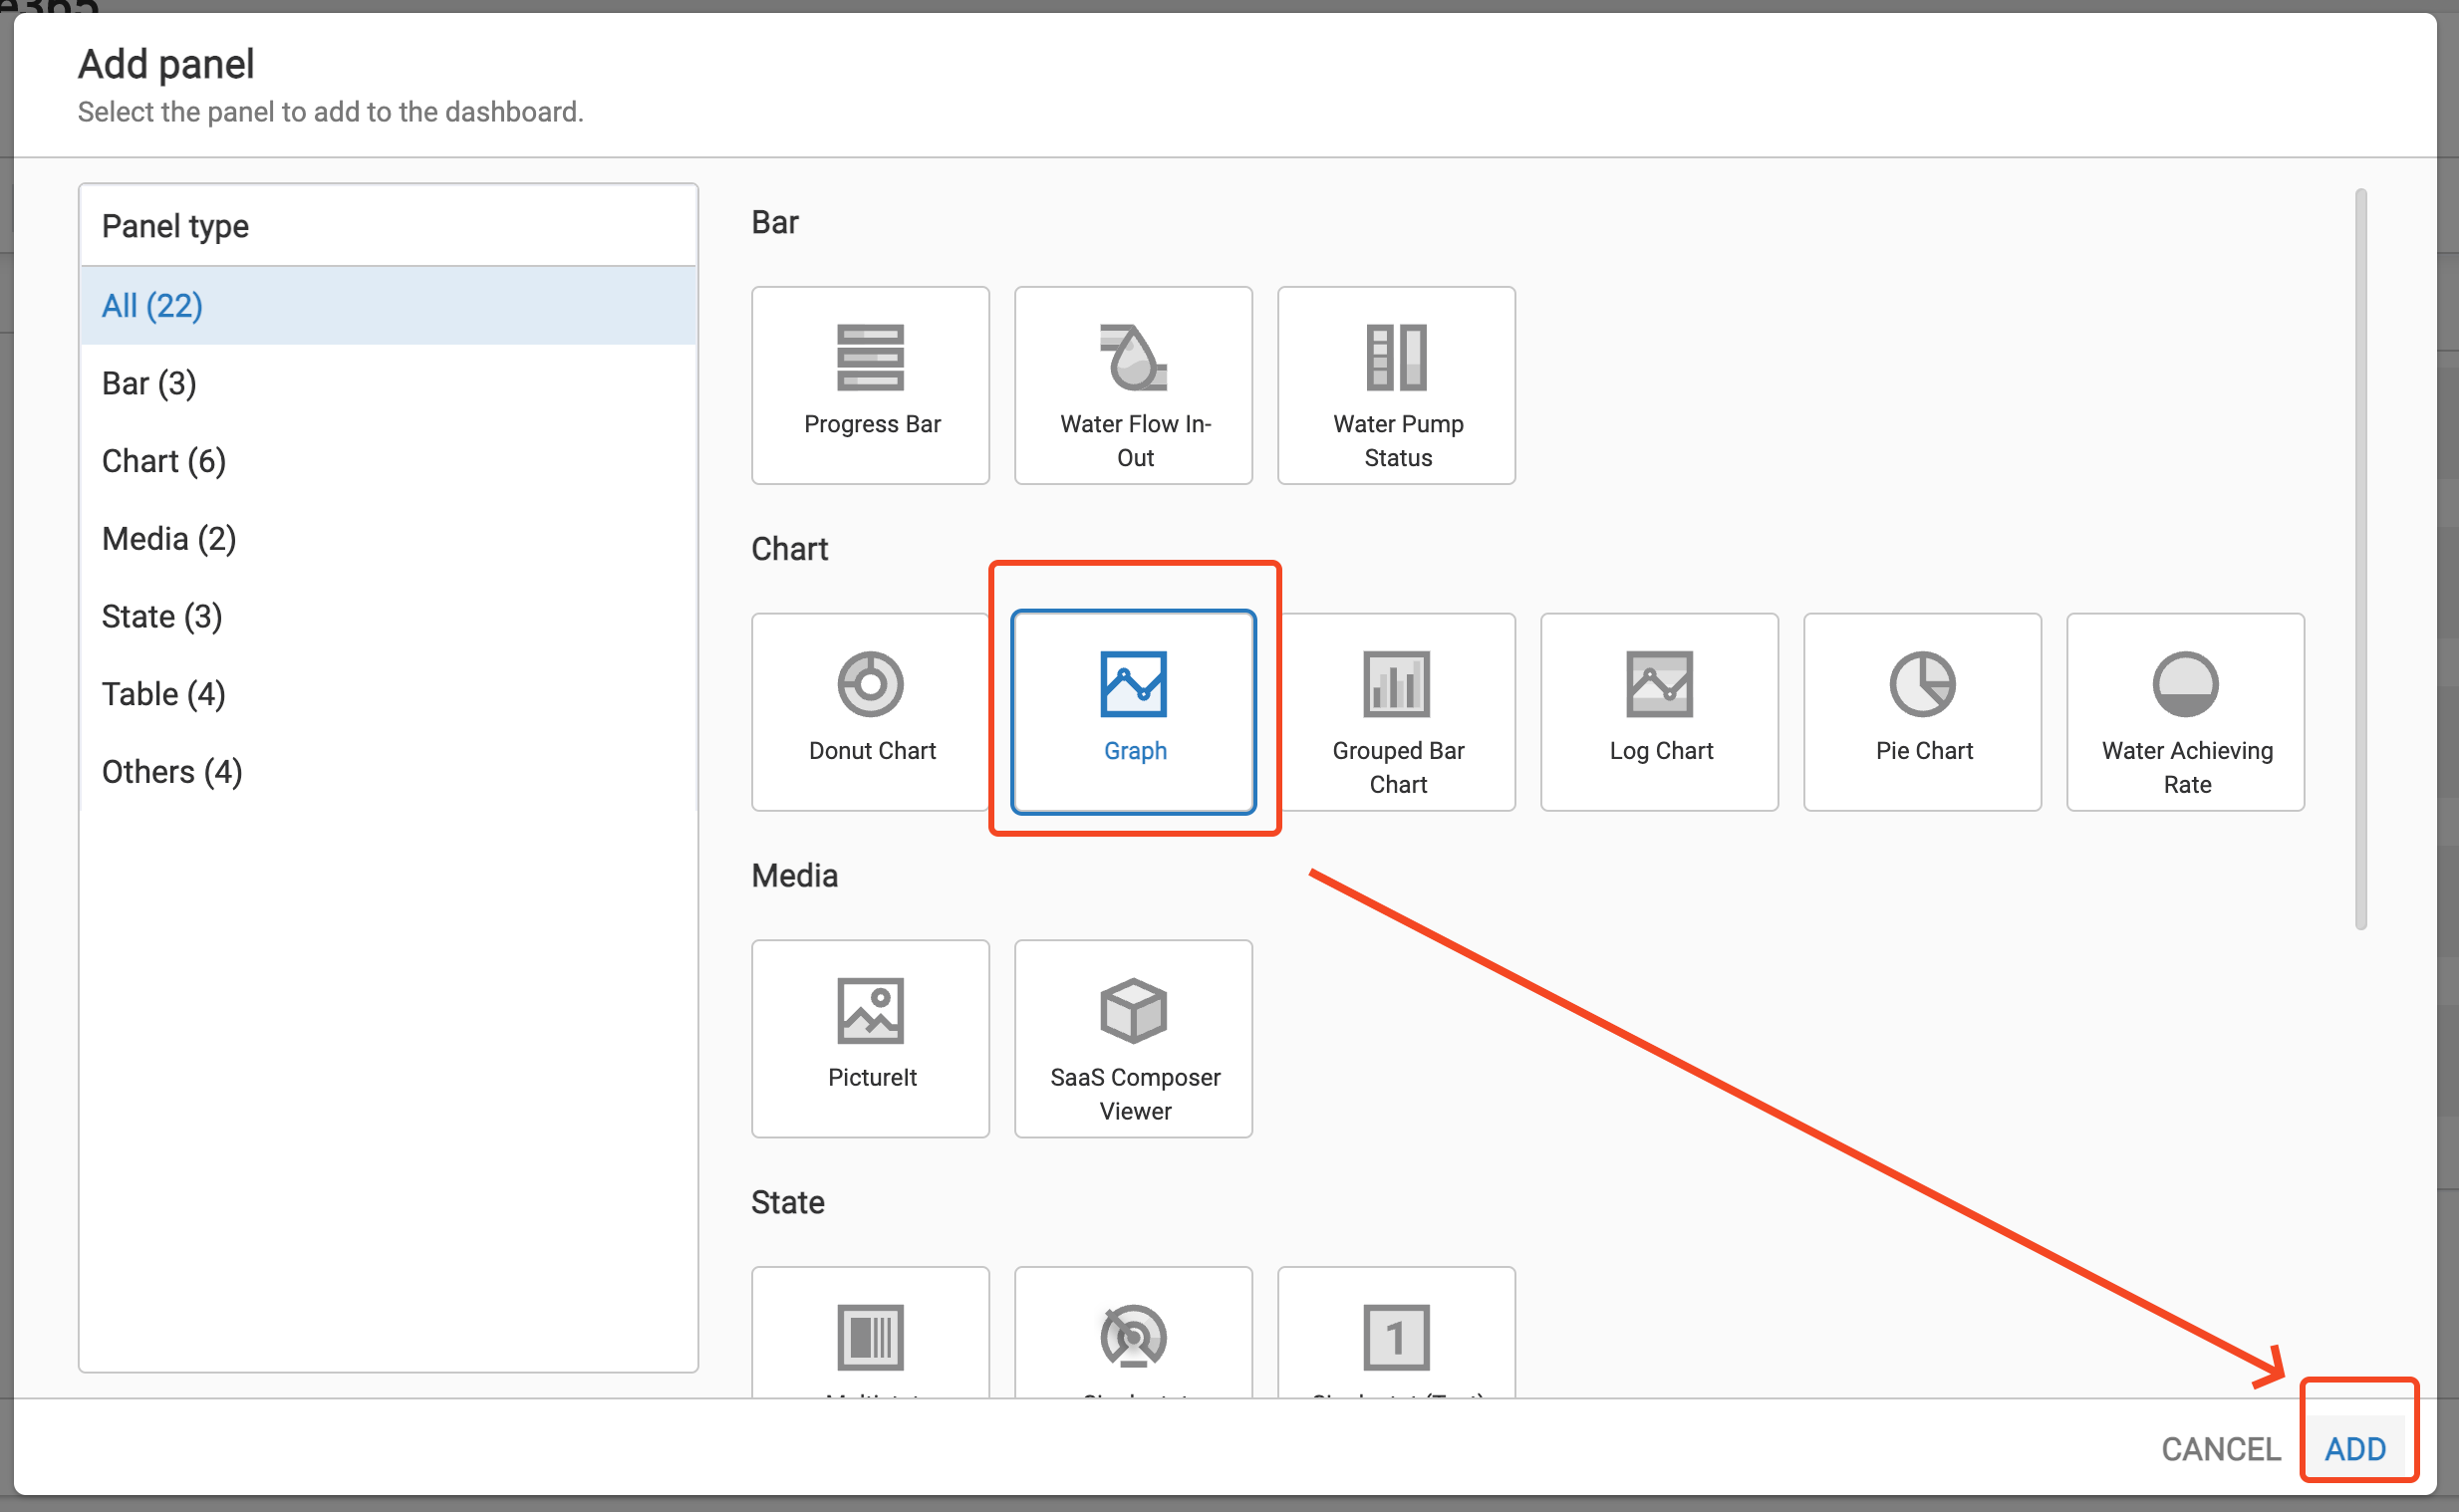
You can click + to add panel on this dashboard
There are 22 supported panel types that can be selected to add to the dashboard.
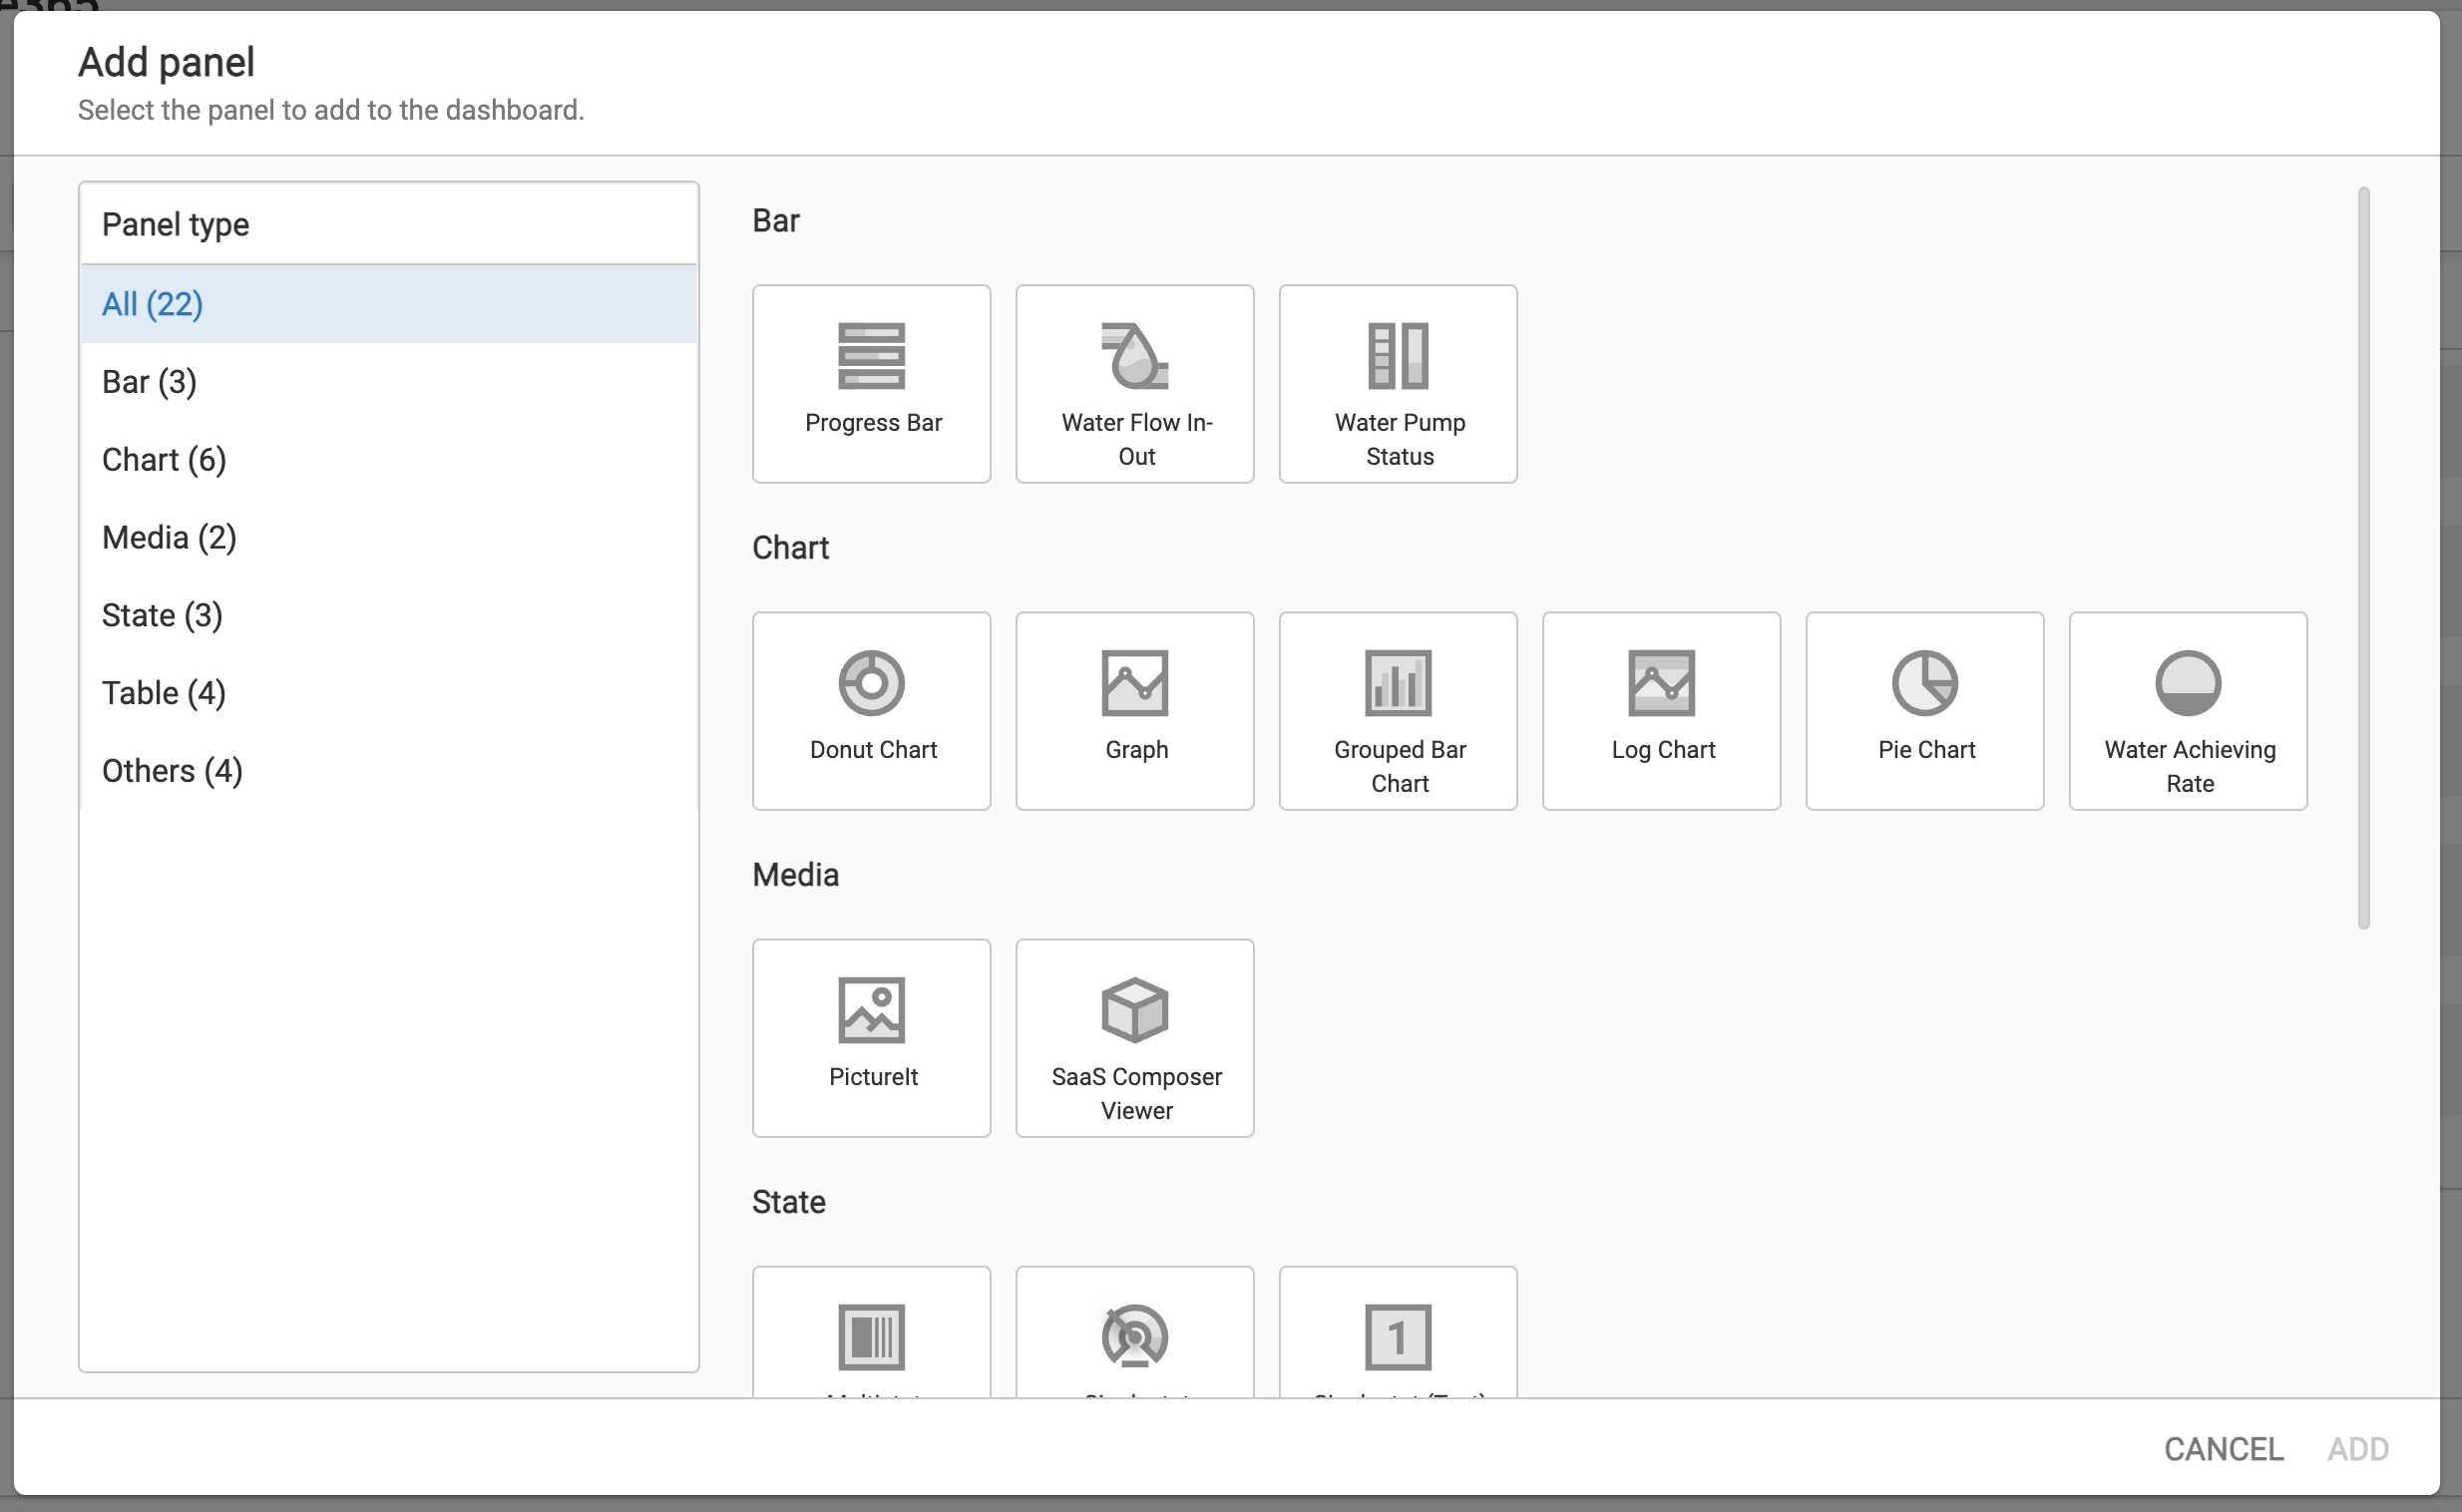
Choose one panel, such as Graph, and click ADD
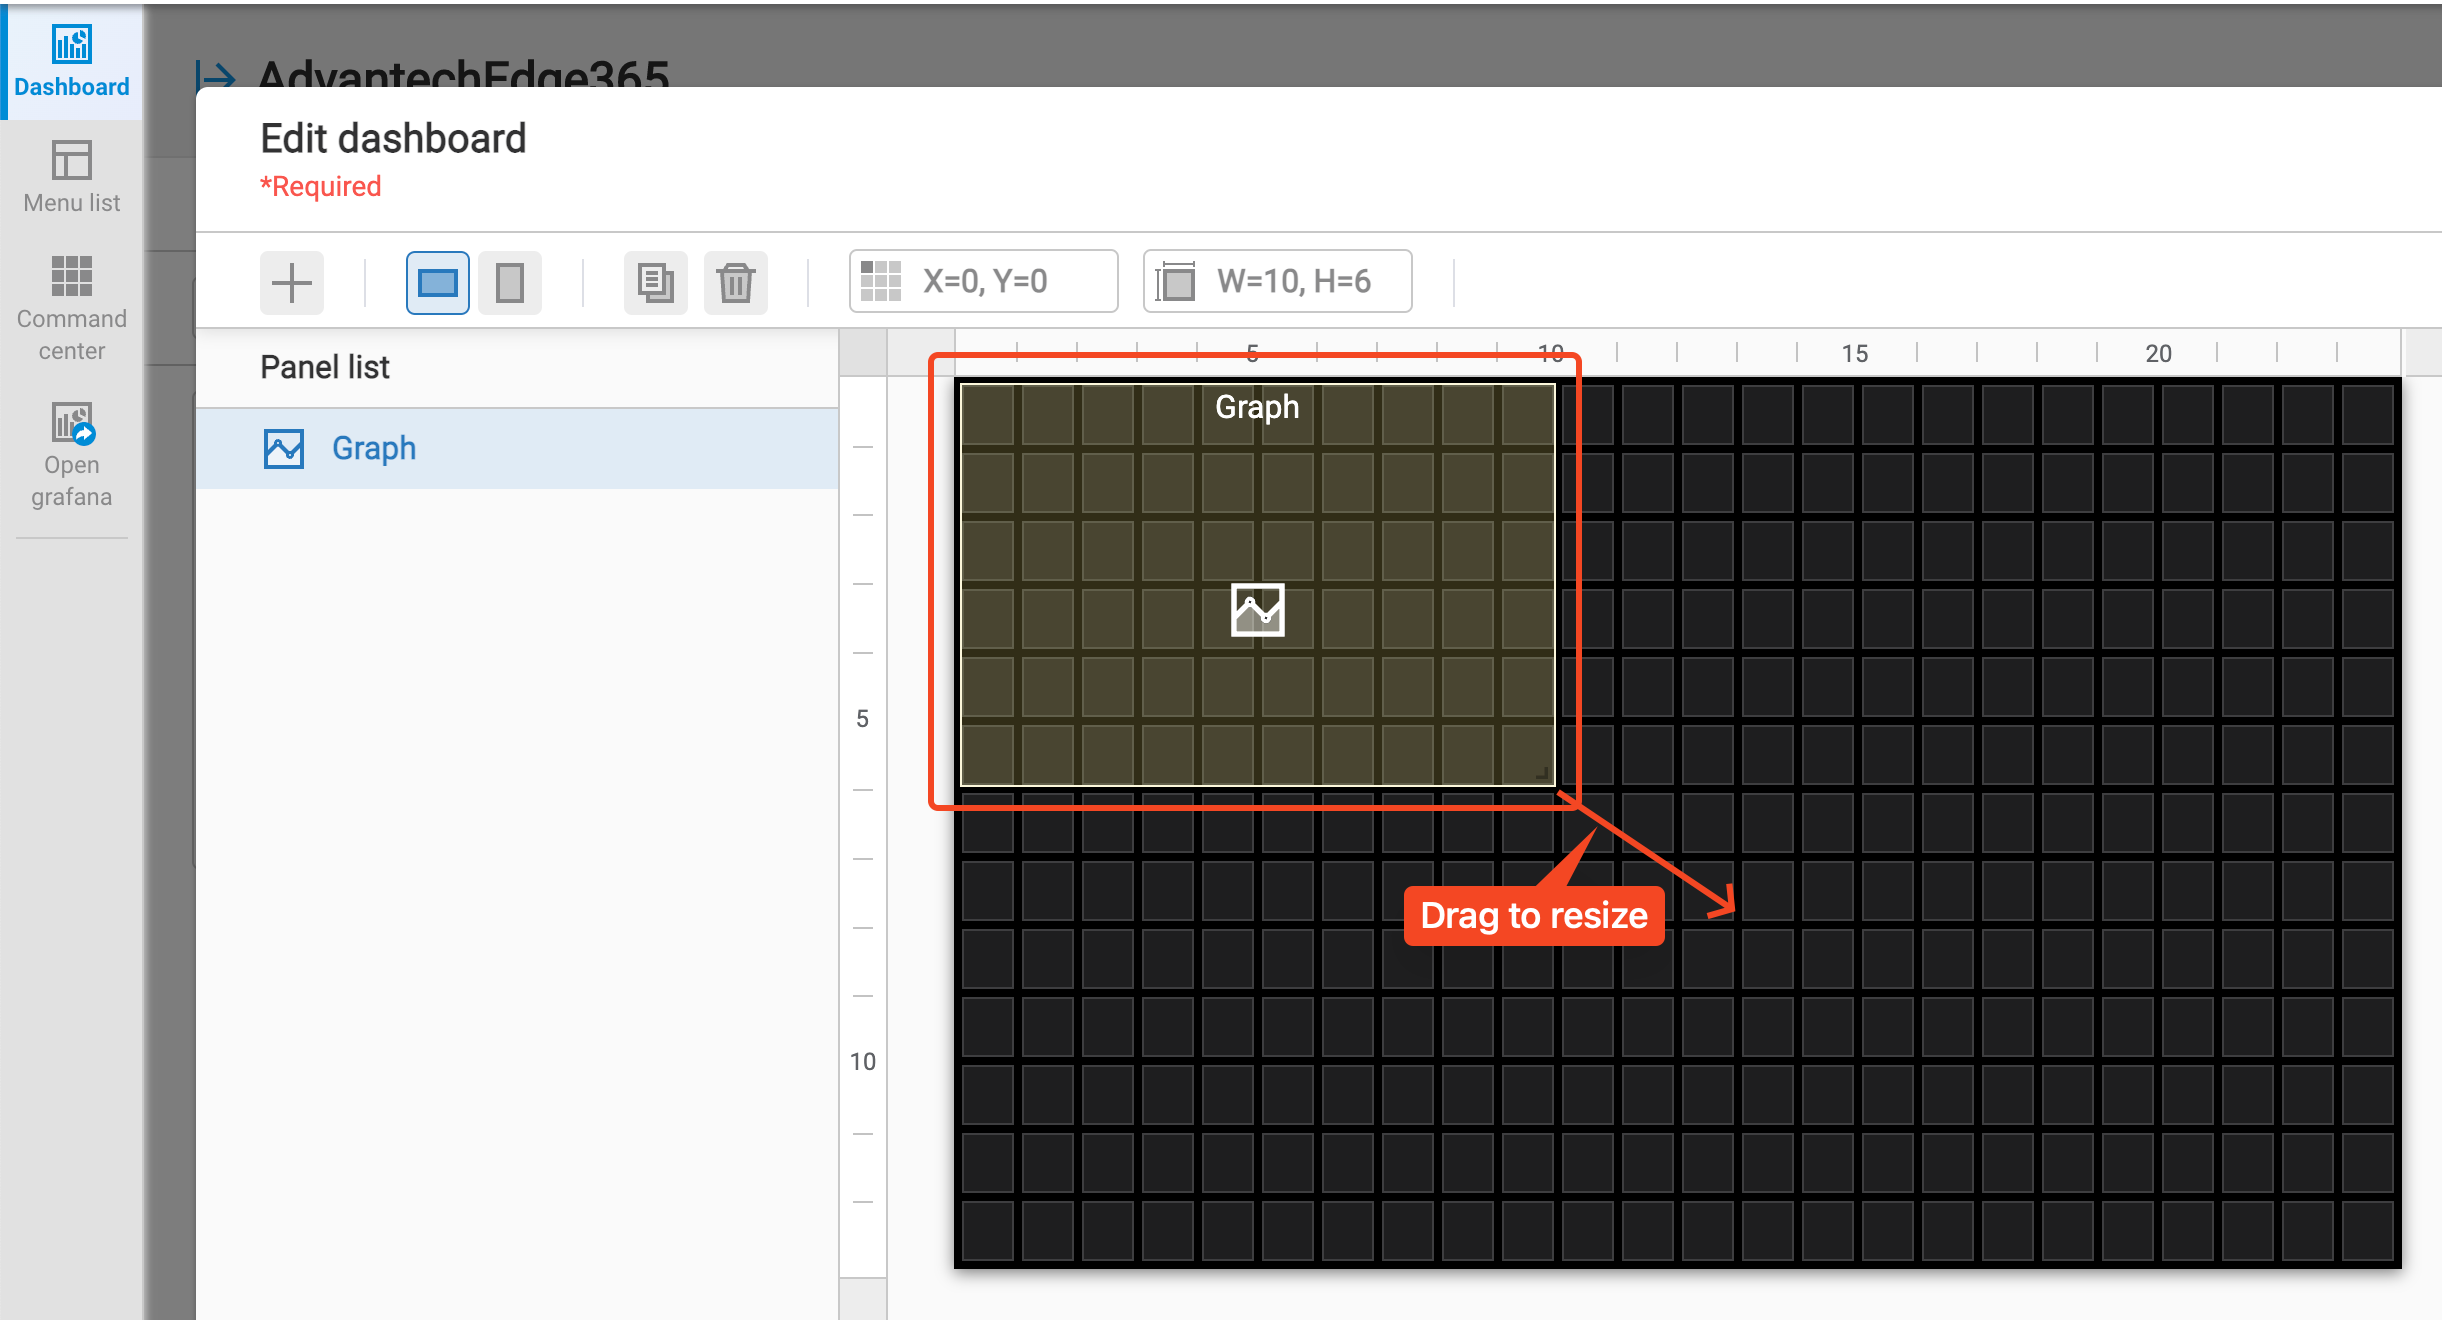
The selected panel will be added to the dashboard area. You can drag the panel to resize it.
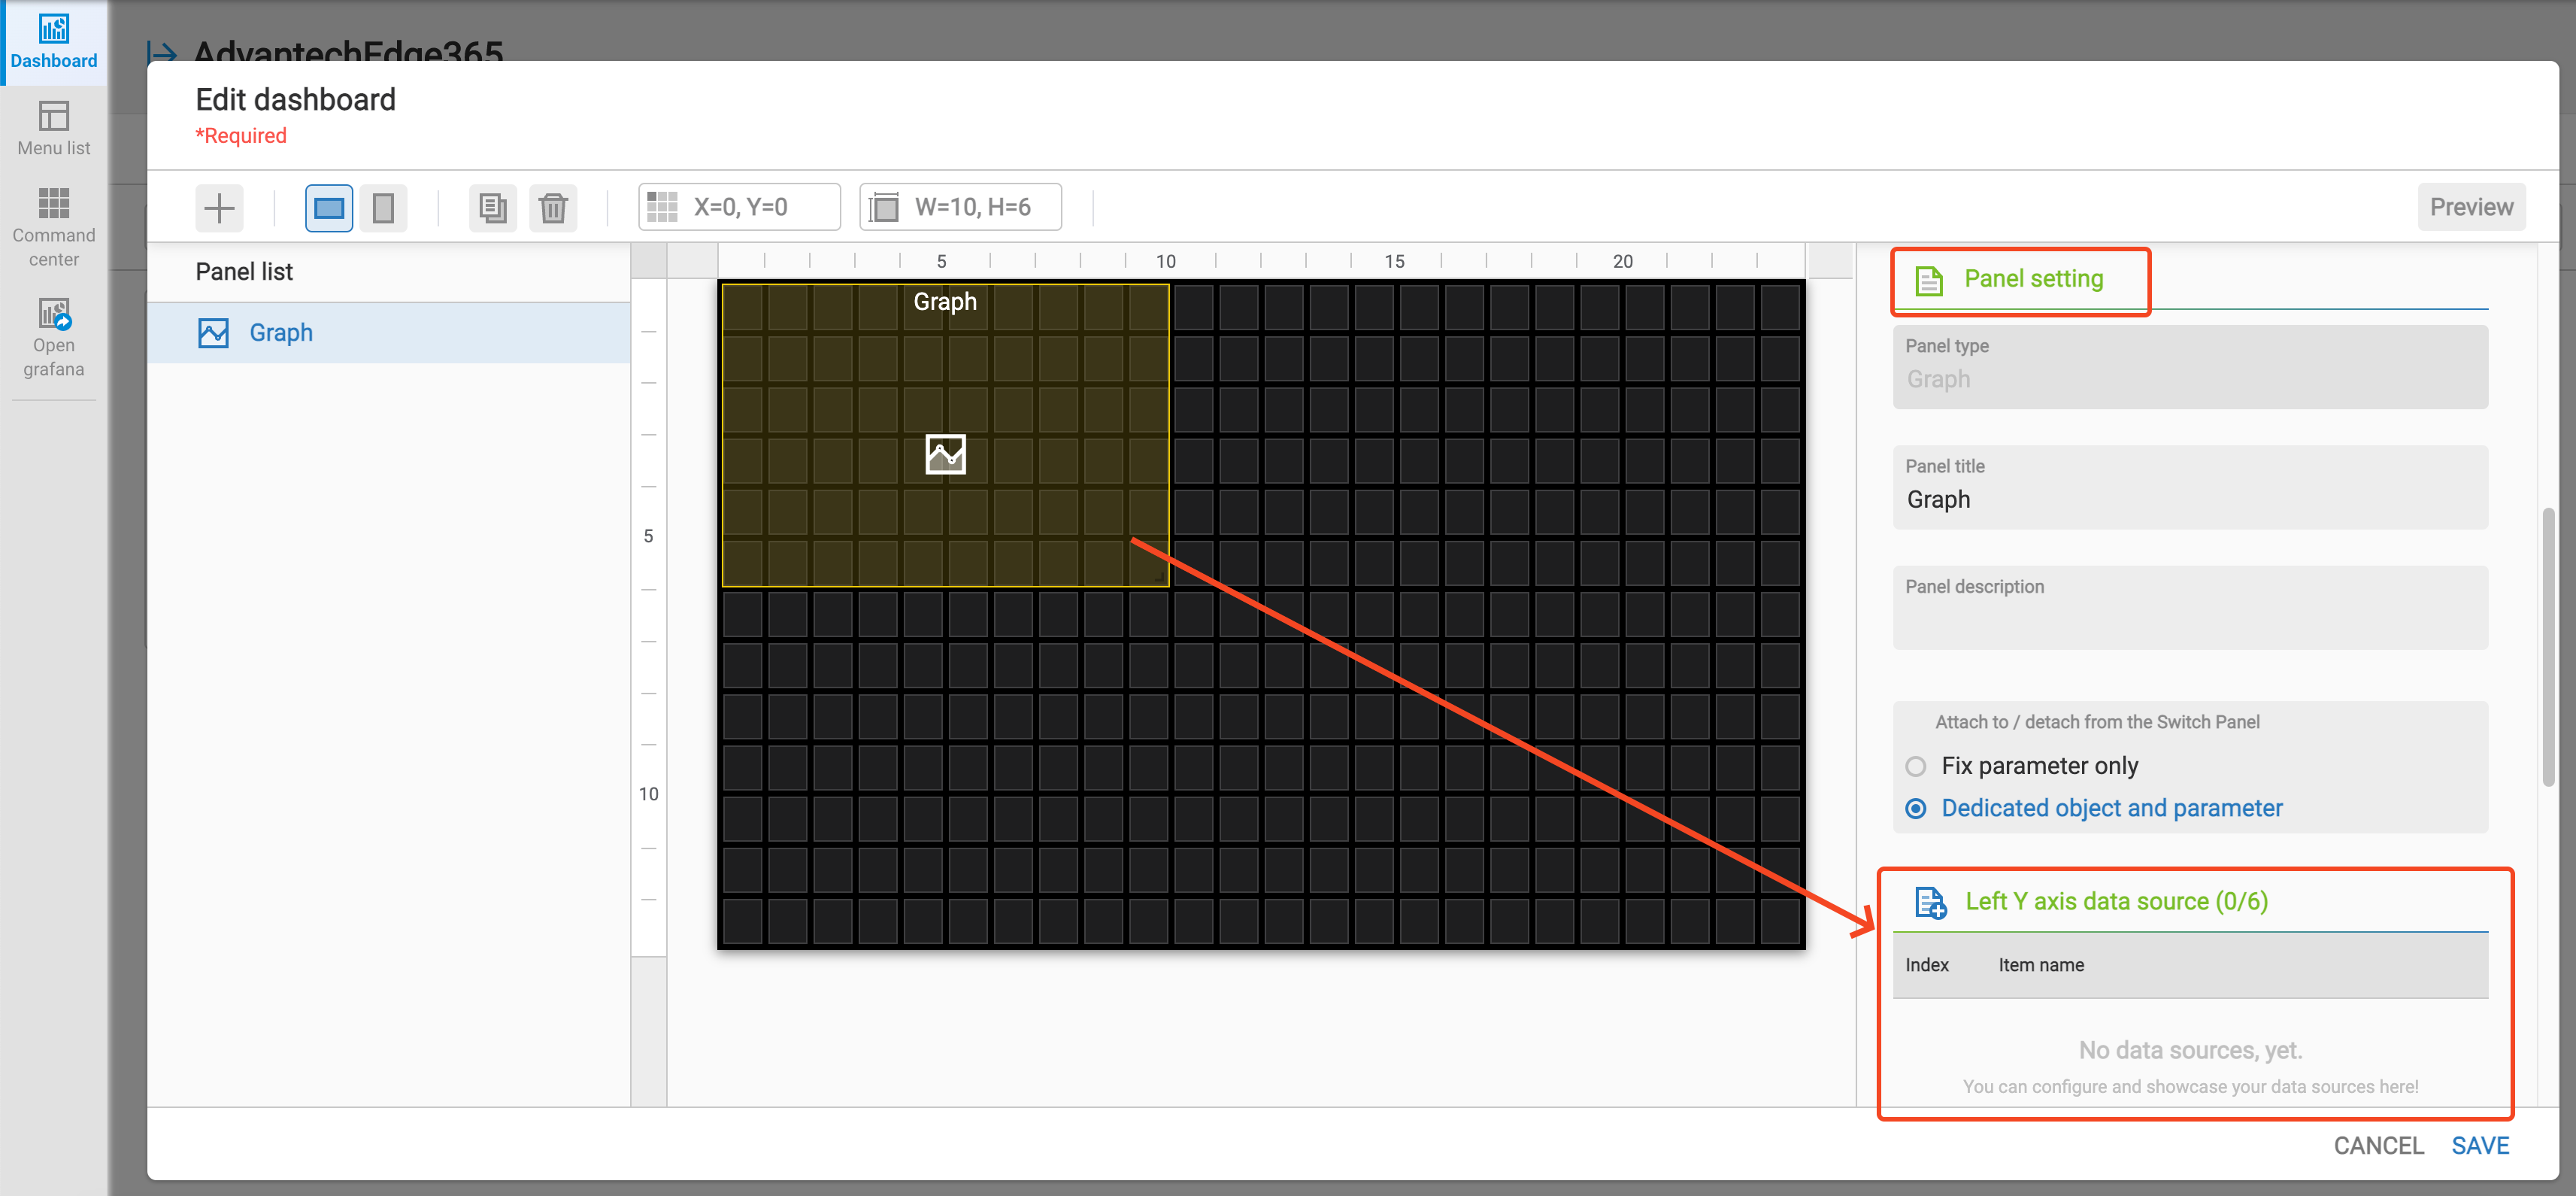
Also, you have to config the Panel Setting of this panel, such as Panel title, datasource,...etc.
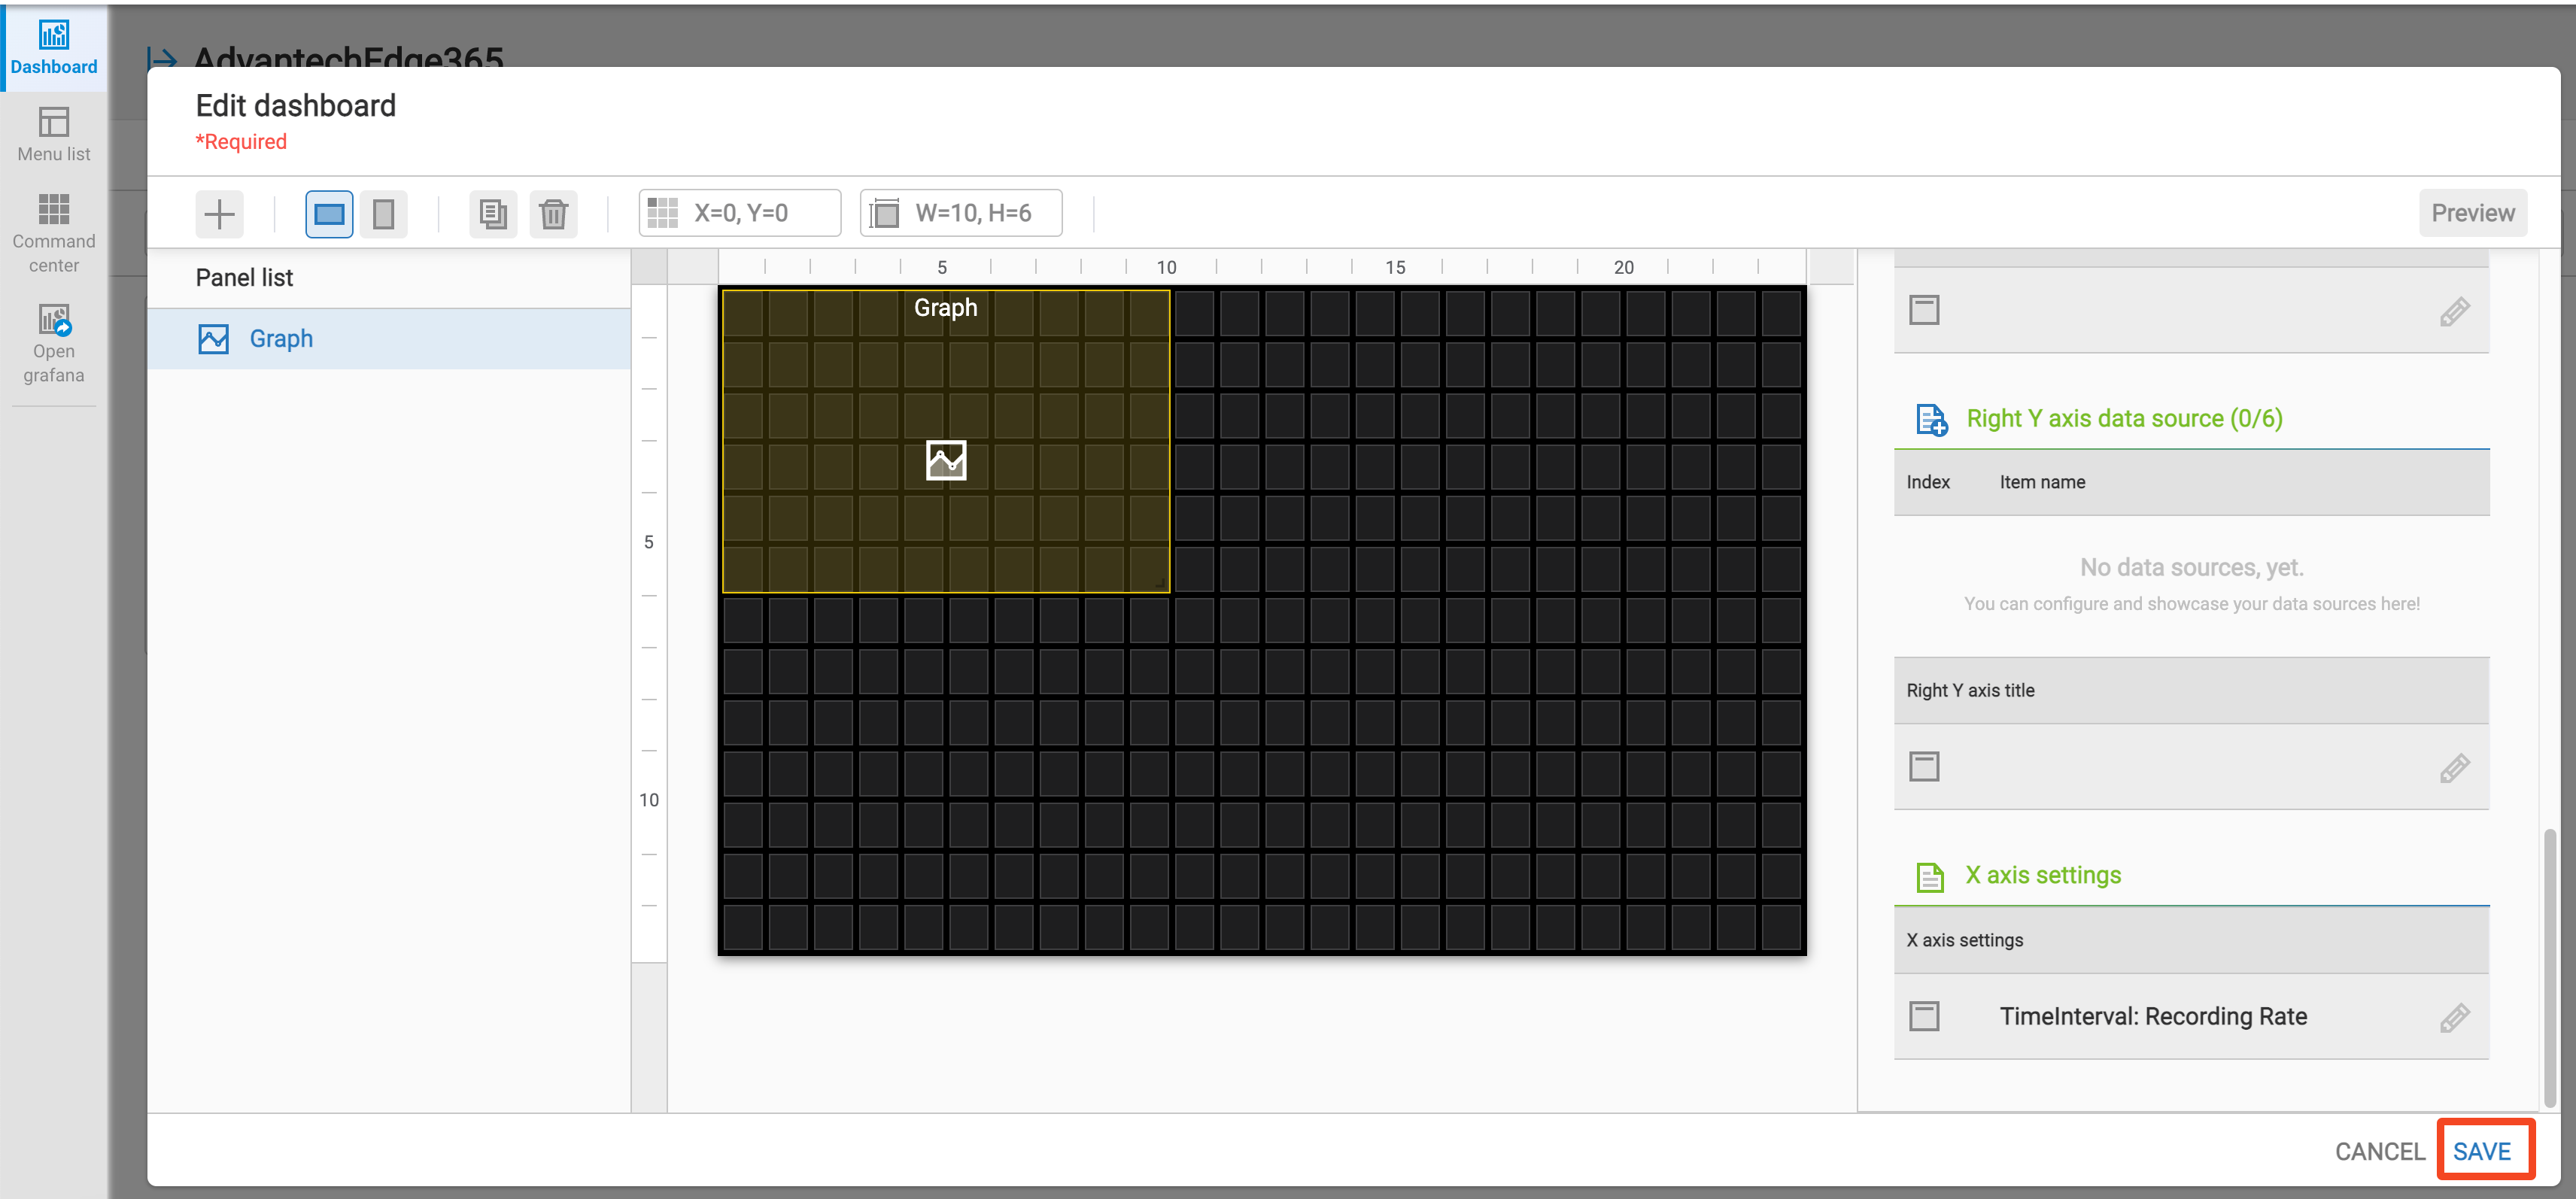
After you finish the layout plan of this dashboard, click SAVE to save the setting of this dashboard
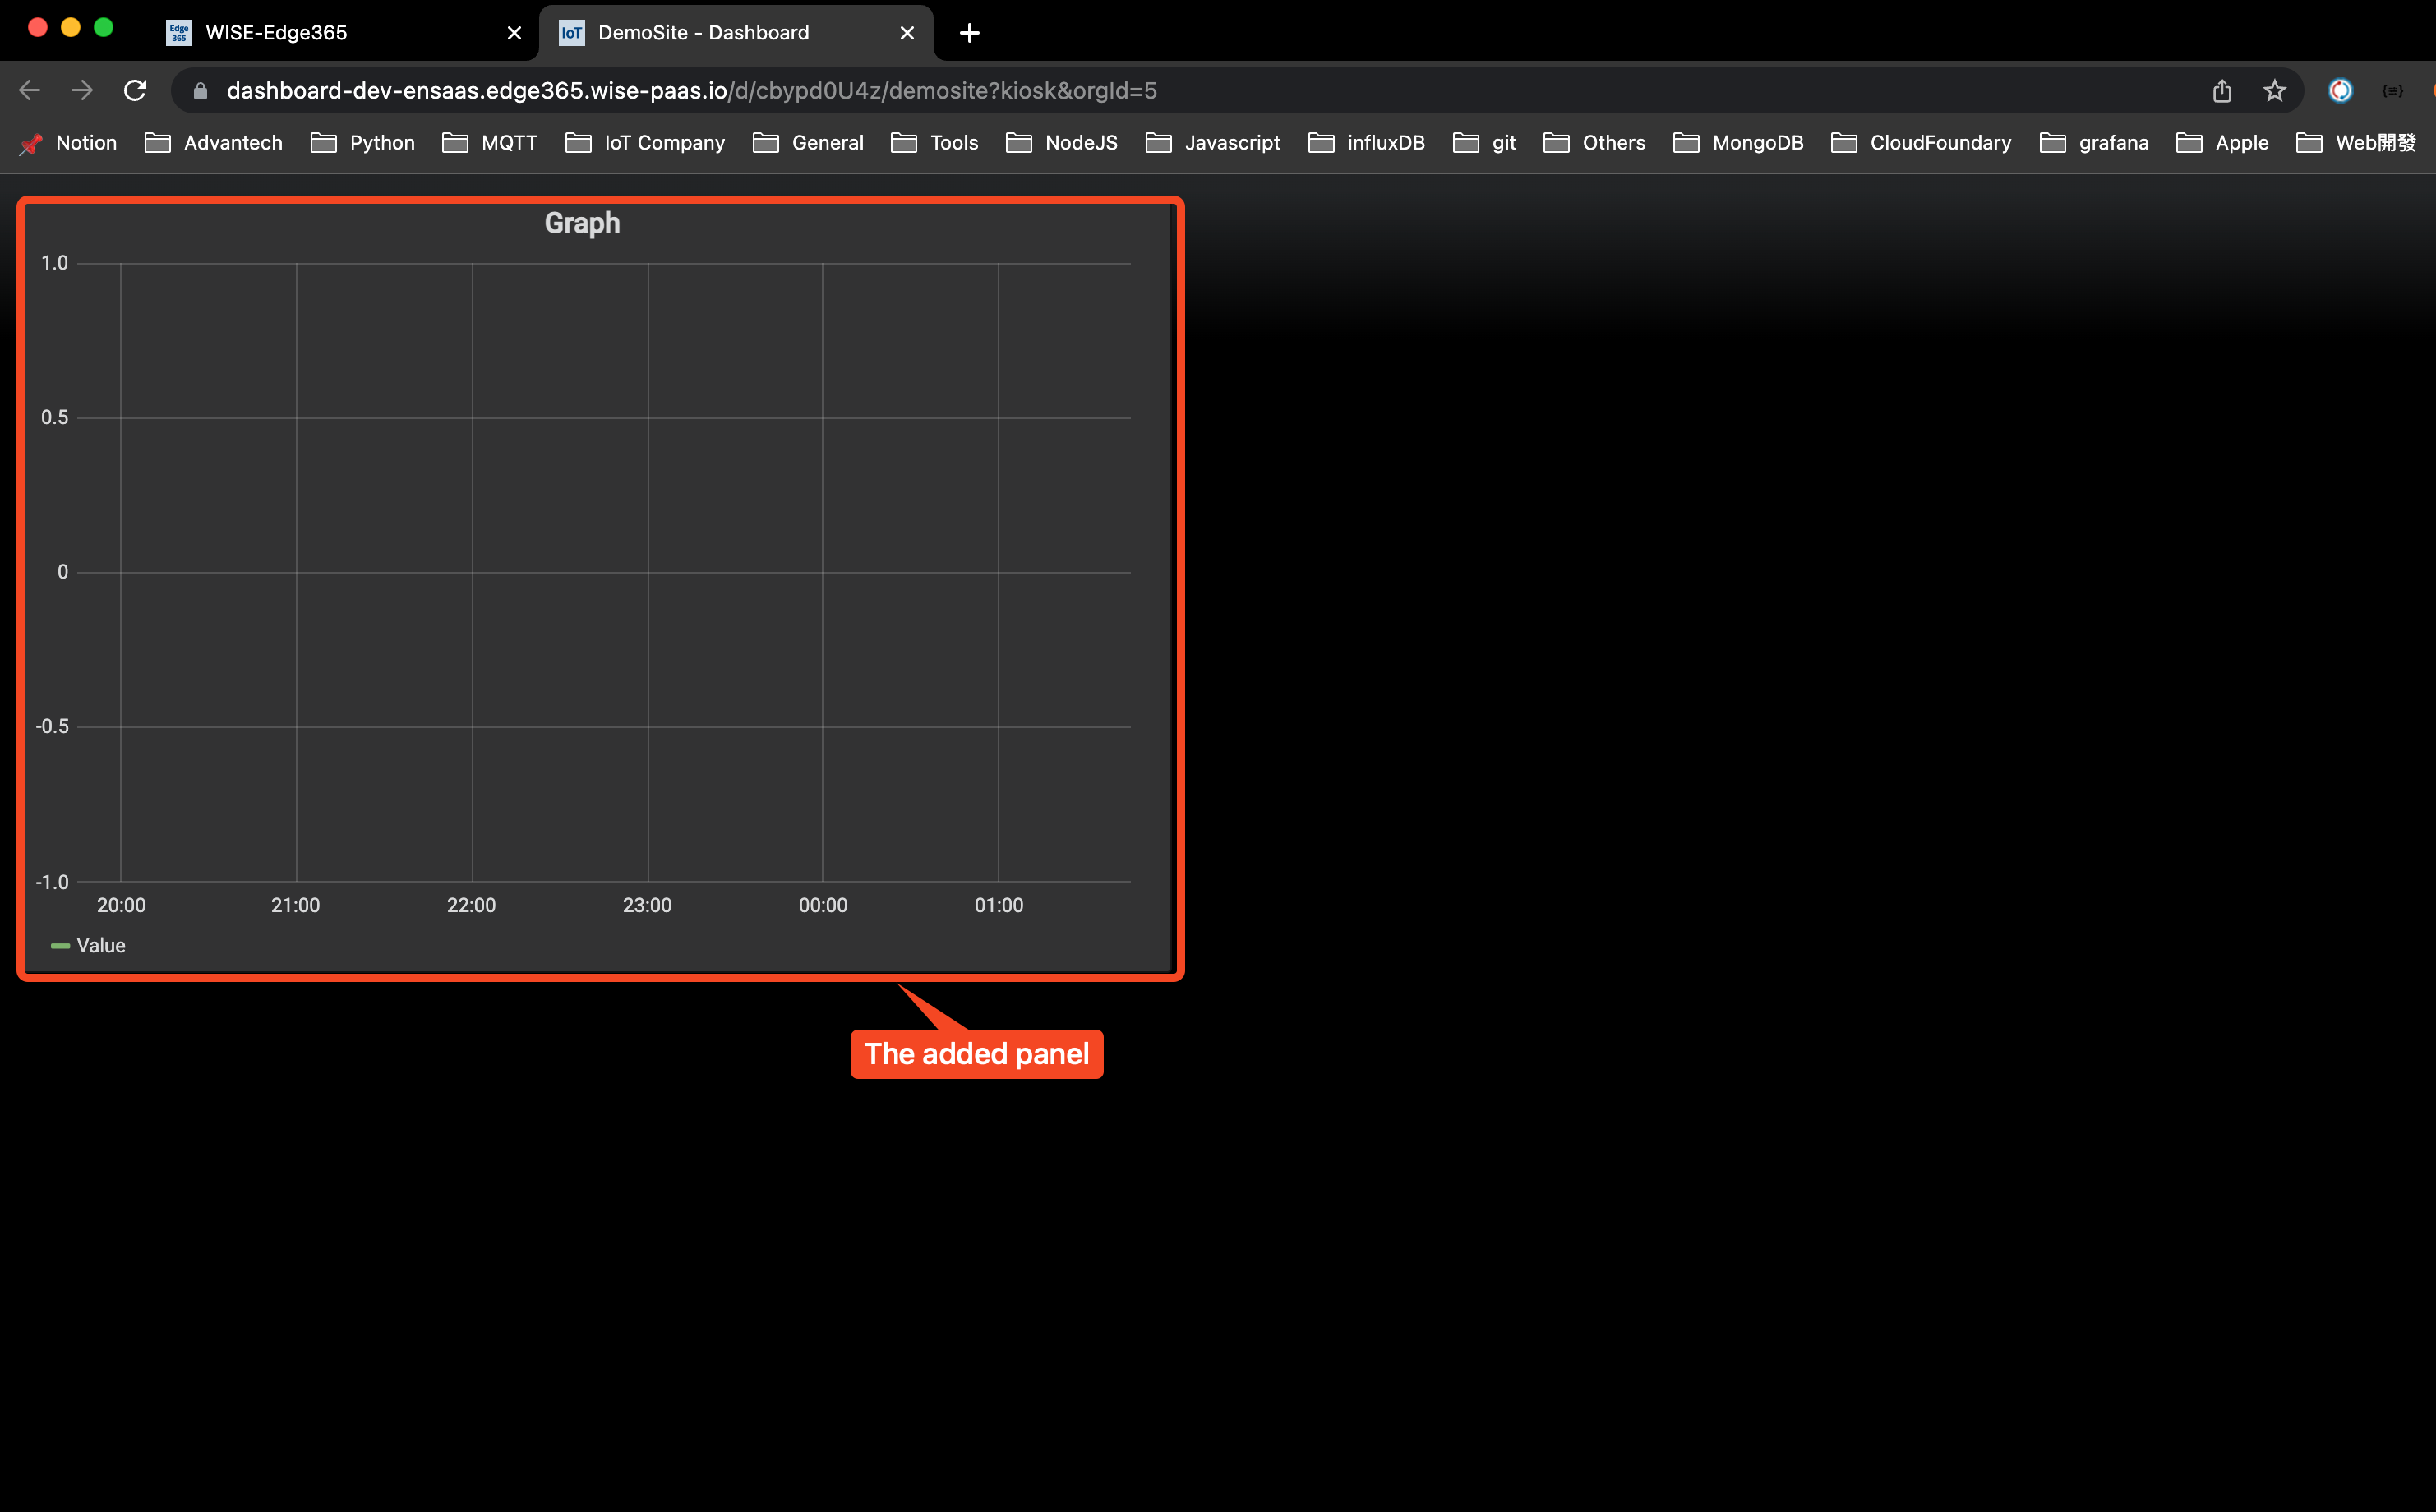
Click Preview Dashboard to view the result of this dashboard
It will open a new browser tab to display the dashboard