Datasource
Changelog
| Version | Author | Update date | Comment |
|---|---|---|---|
| 1.0.1 | ITsung.Shen | 2023/11/16 | First Version |
| 2.2.0 | ITsung.Shen | 2024/10/01 | Update datasource name as EdgeHub-SimpleJsonAdd section 2 - Datasource field description |
| 2.3.0 | ITsung.Shen | 2025/02/12 | Support source = EdgeHub-device-managementMade the follow changes:- Update section 2.2 / 2.7 / 2.9- Add section 2.17 / 2.18 / 2.19 |
1. Introduction
When you want to generate a data visualization with EdgeHub's data in the Dashboard, you need to use the datasource provided by EdgeHub to achieve this. The EdgeHub datasource is a plugin for the dashboard that provides users with the following content:
- Real-time data for parameters
- Historical data for parameters, including maximum/minimum/average/last value(or difference of value)
- Various computed functions, including alarm log, report, YoY, etc. We will explain these functions in detail in the Datasource functions section.
You can start using the EdgeHub datasource in the Dashboard by following these steps:
-
Use
Command Center->Open...->Dashboard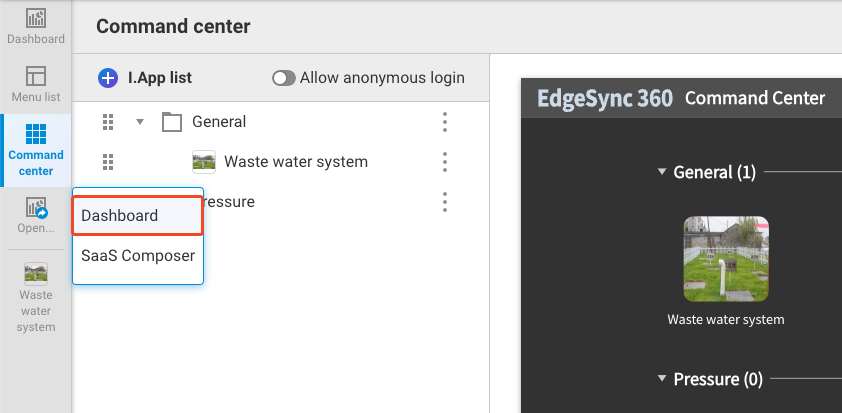
-
A new page will open, displaying the Dashboard page
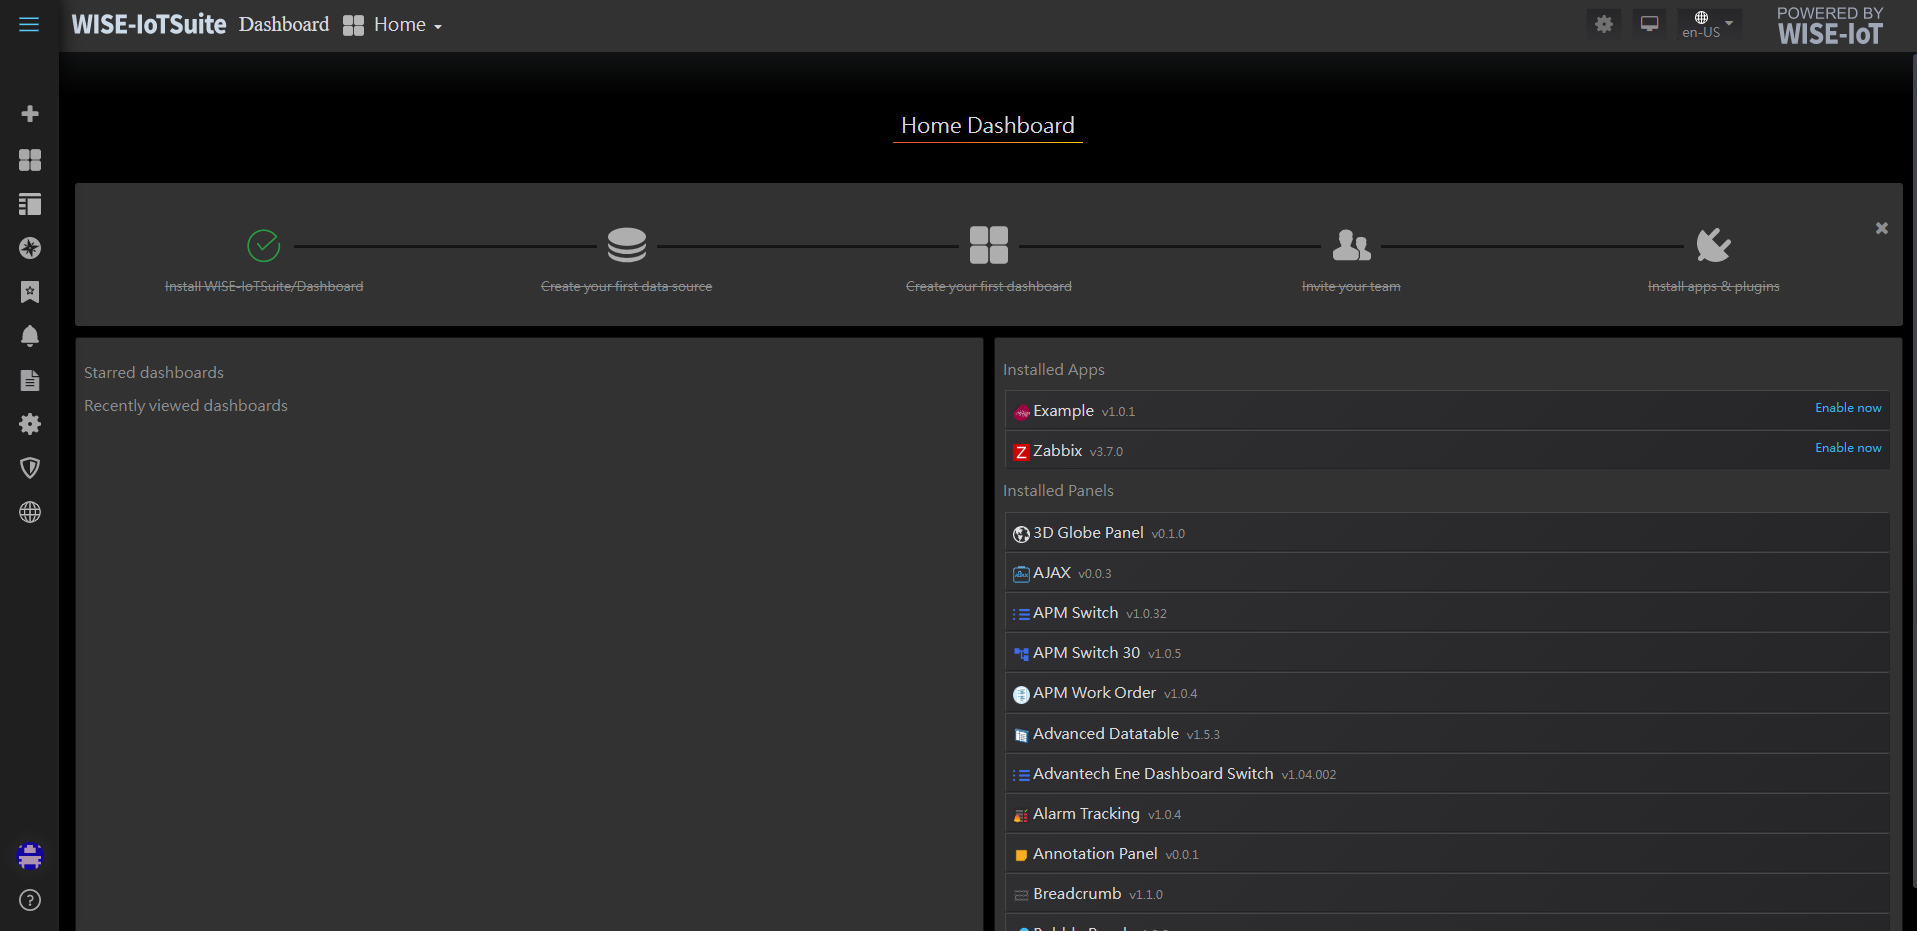
-
Hover your mouse over
+and selectDashboardto create a new dashboard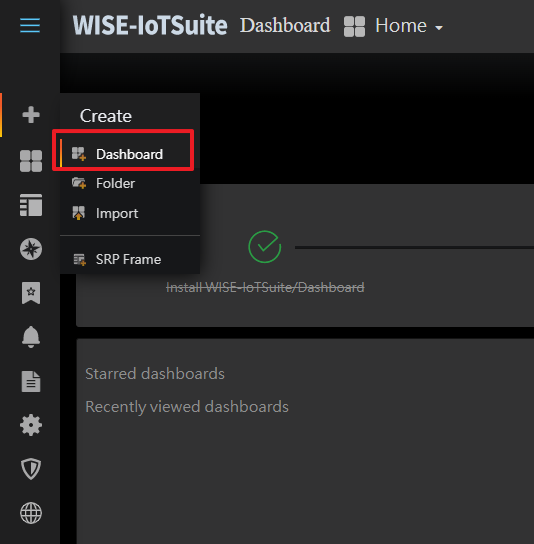
-
A new dashboard has been created. Click on
Add Query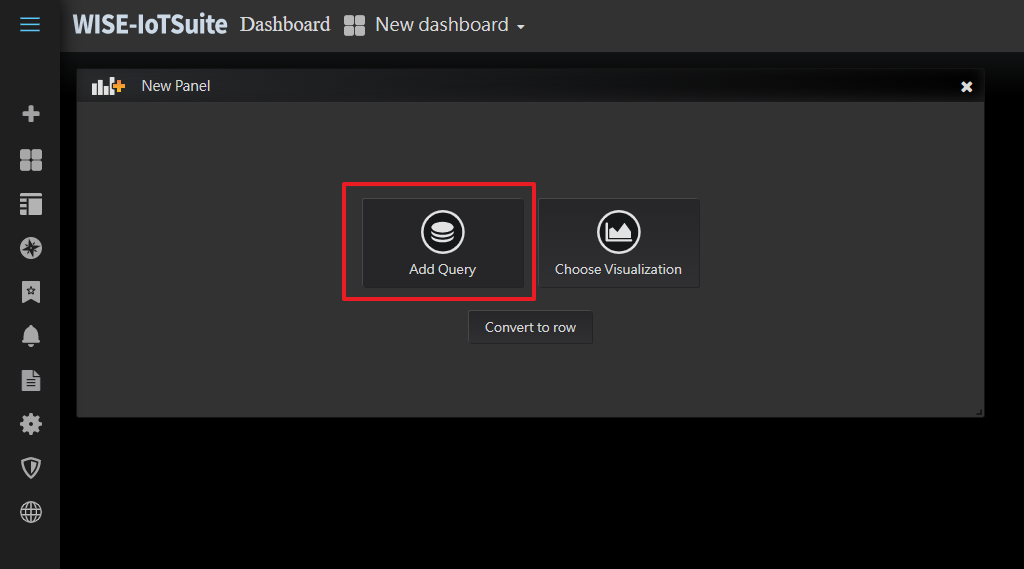
-
You can see that the EdgeHub datasource is set as the default datasource, and you can see all of the configuration options for the EdgeHub datasource.
-
If there are other datasources present in your Dashboard environment, you can switch back to the EdgeHub datasource option by selecting
EdgeHub-SimpleJsondatasource.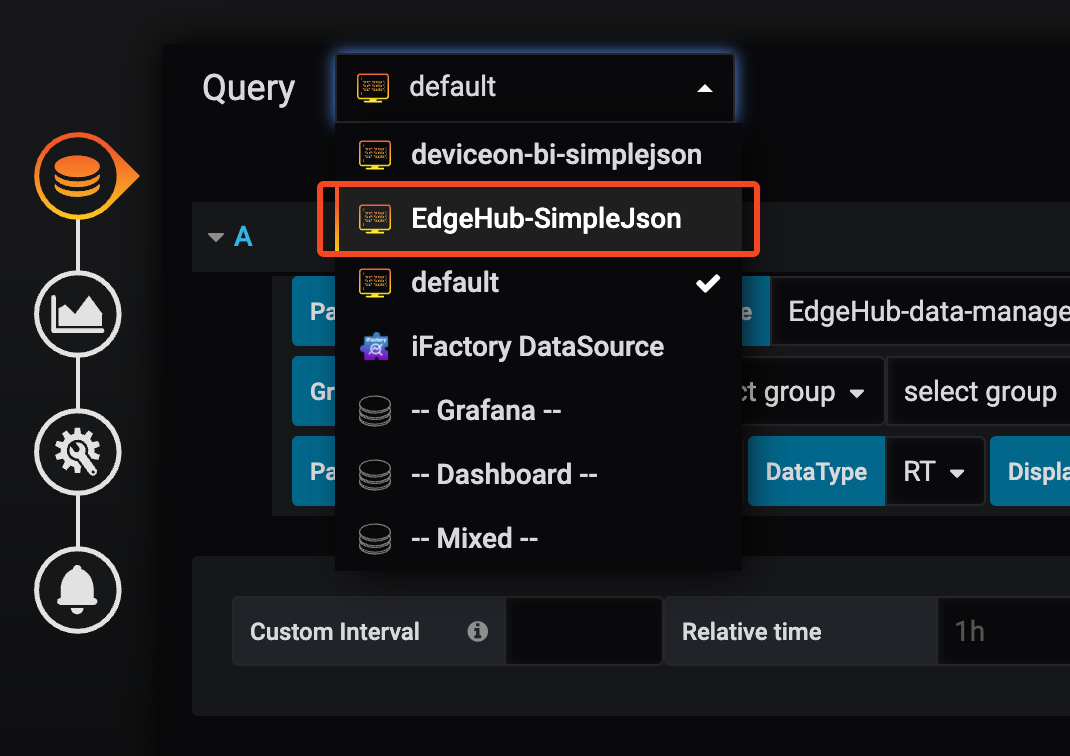
2. Datasource field description
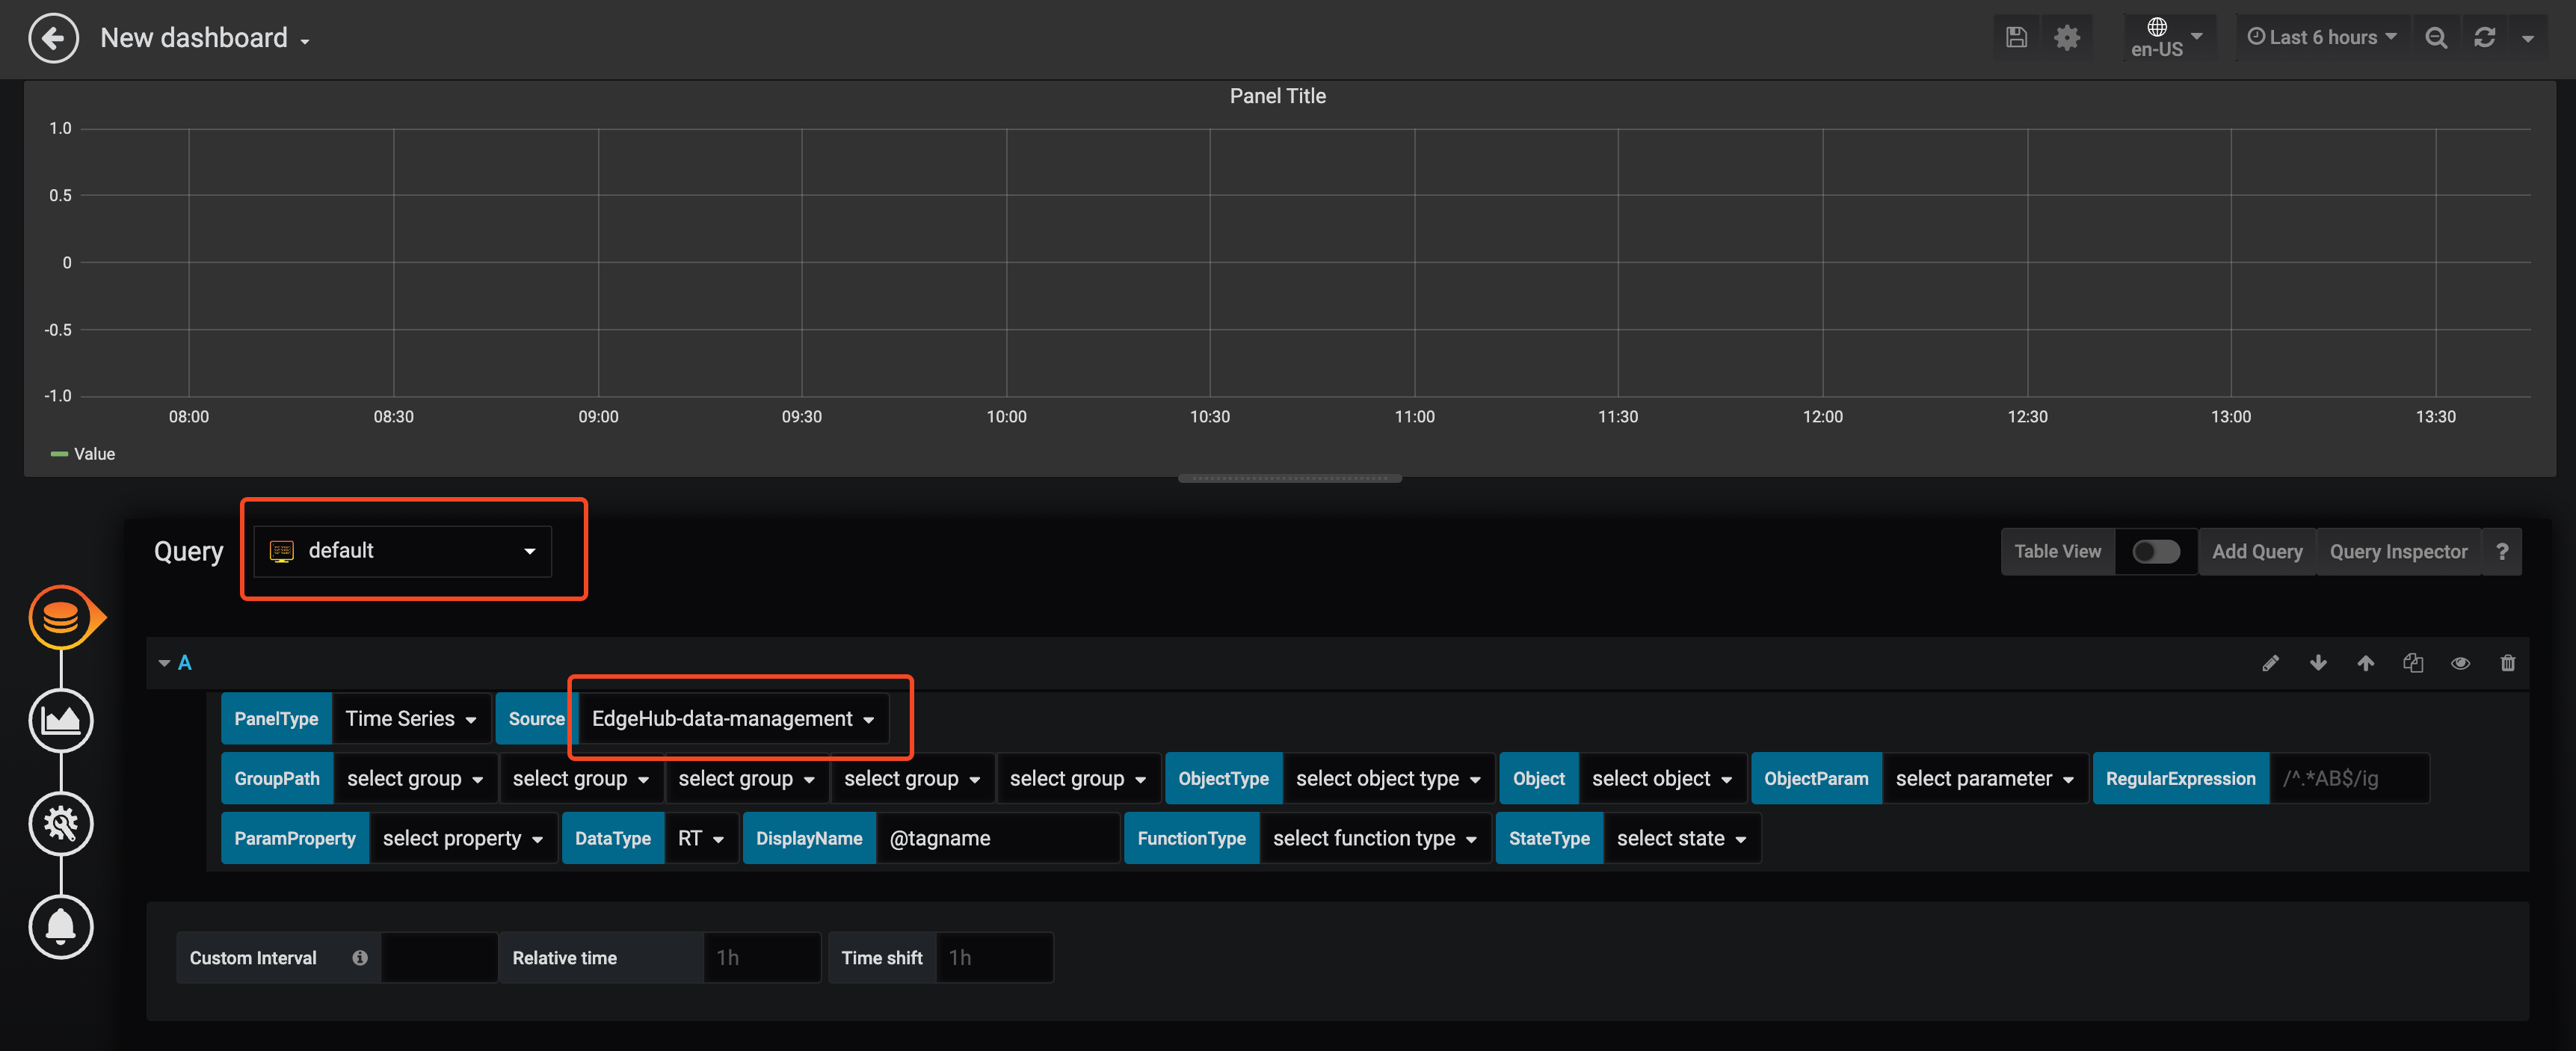
This section explains the usage of each field in the EdgeHub datasource. The current version of the EdgeHub datasource is shown in the figure below.
2.1 PanelType
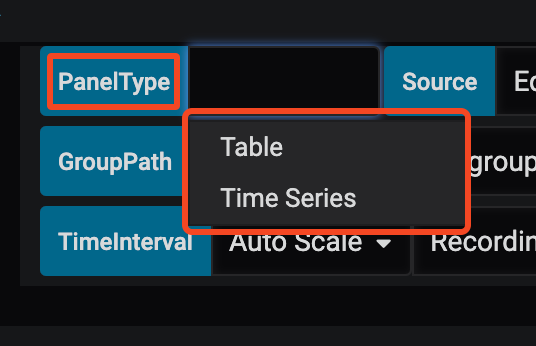
Used to specify the format of the returned data, which can be classified into two types:
-
Time Series
Returns data to the Dashboard in time series format. The data will include the following three basic fields:
- target: The source of the data, usually a parameter name.
- value: The data value.
- time: The time of the data.
This format is typically used for displaying line graphs, tables, bar charts, etc., and is also the default value for the current EdgeHub datasource.
-
Table
Returns data to the Dashboard in table format. The data will include the following four basic fields:
- Timestamp: The time of the data.
- Parameter: The source of the data, which carries the parameter name.
- Description: A description of the data, which carries the parameter description (set on the parameter settings page).
- Value: The data value.
This format is typically used when presenting data in tables.
2.2 Source
The source for accessing internal data in EdgeHub. Currently, it support the following options:
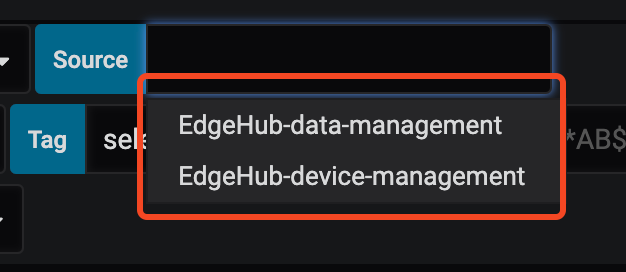
-
EdgeHub-data-management: used to access data related to group/object/parameter. When selecting this option, the following fields need to be configured:- GroupPath (Ref. to section 2.3)
- ObjectType (Ref. to section 2.4)
- Object (Ref. to section 2.5)
- ObjectParam (Ref. to section 2.6)
- ParamProperty (Ref. to section 2.8)
-
EdgeHub-device-management: supported from EdgeHub version 2.3 onwards, used to access Device/tag data. When selecting this option, the following fields need to be configured:- Device (Ref. to section 2.17)
- Tag (Ref. to section 2.18)
- TagProperty (Ref. to section 2.19)
2.3 GroupPath
Select the Group relationship structure configured in EdgeHub. Currently supports up to five layers. To query data under a specific Group, please select the corresponding Group in order.

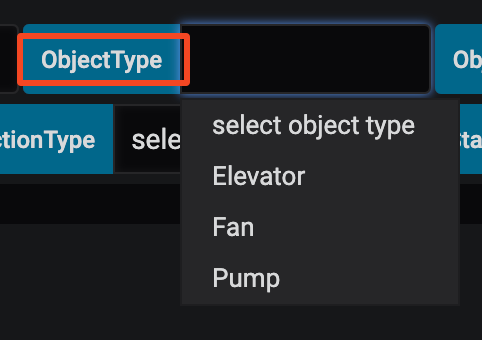
2.4 ObjectType
Corresponds to the Object type field configured in EdgeHub. If the Object under the selected GroupPath has an Object type configured, you can filter using this menu. If it has never been configured, this menu can be ignored.
-
ObjectType Menu
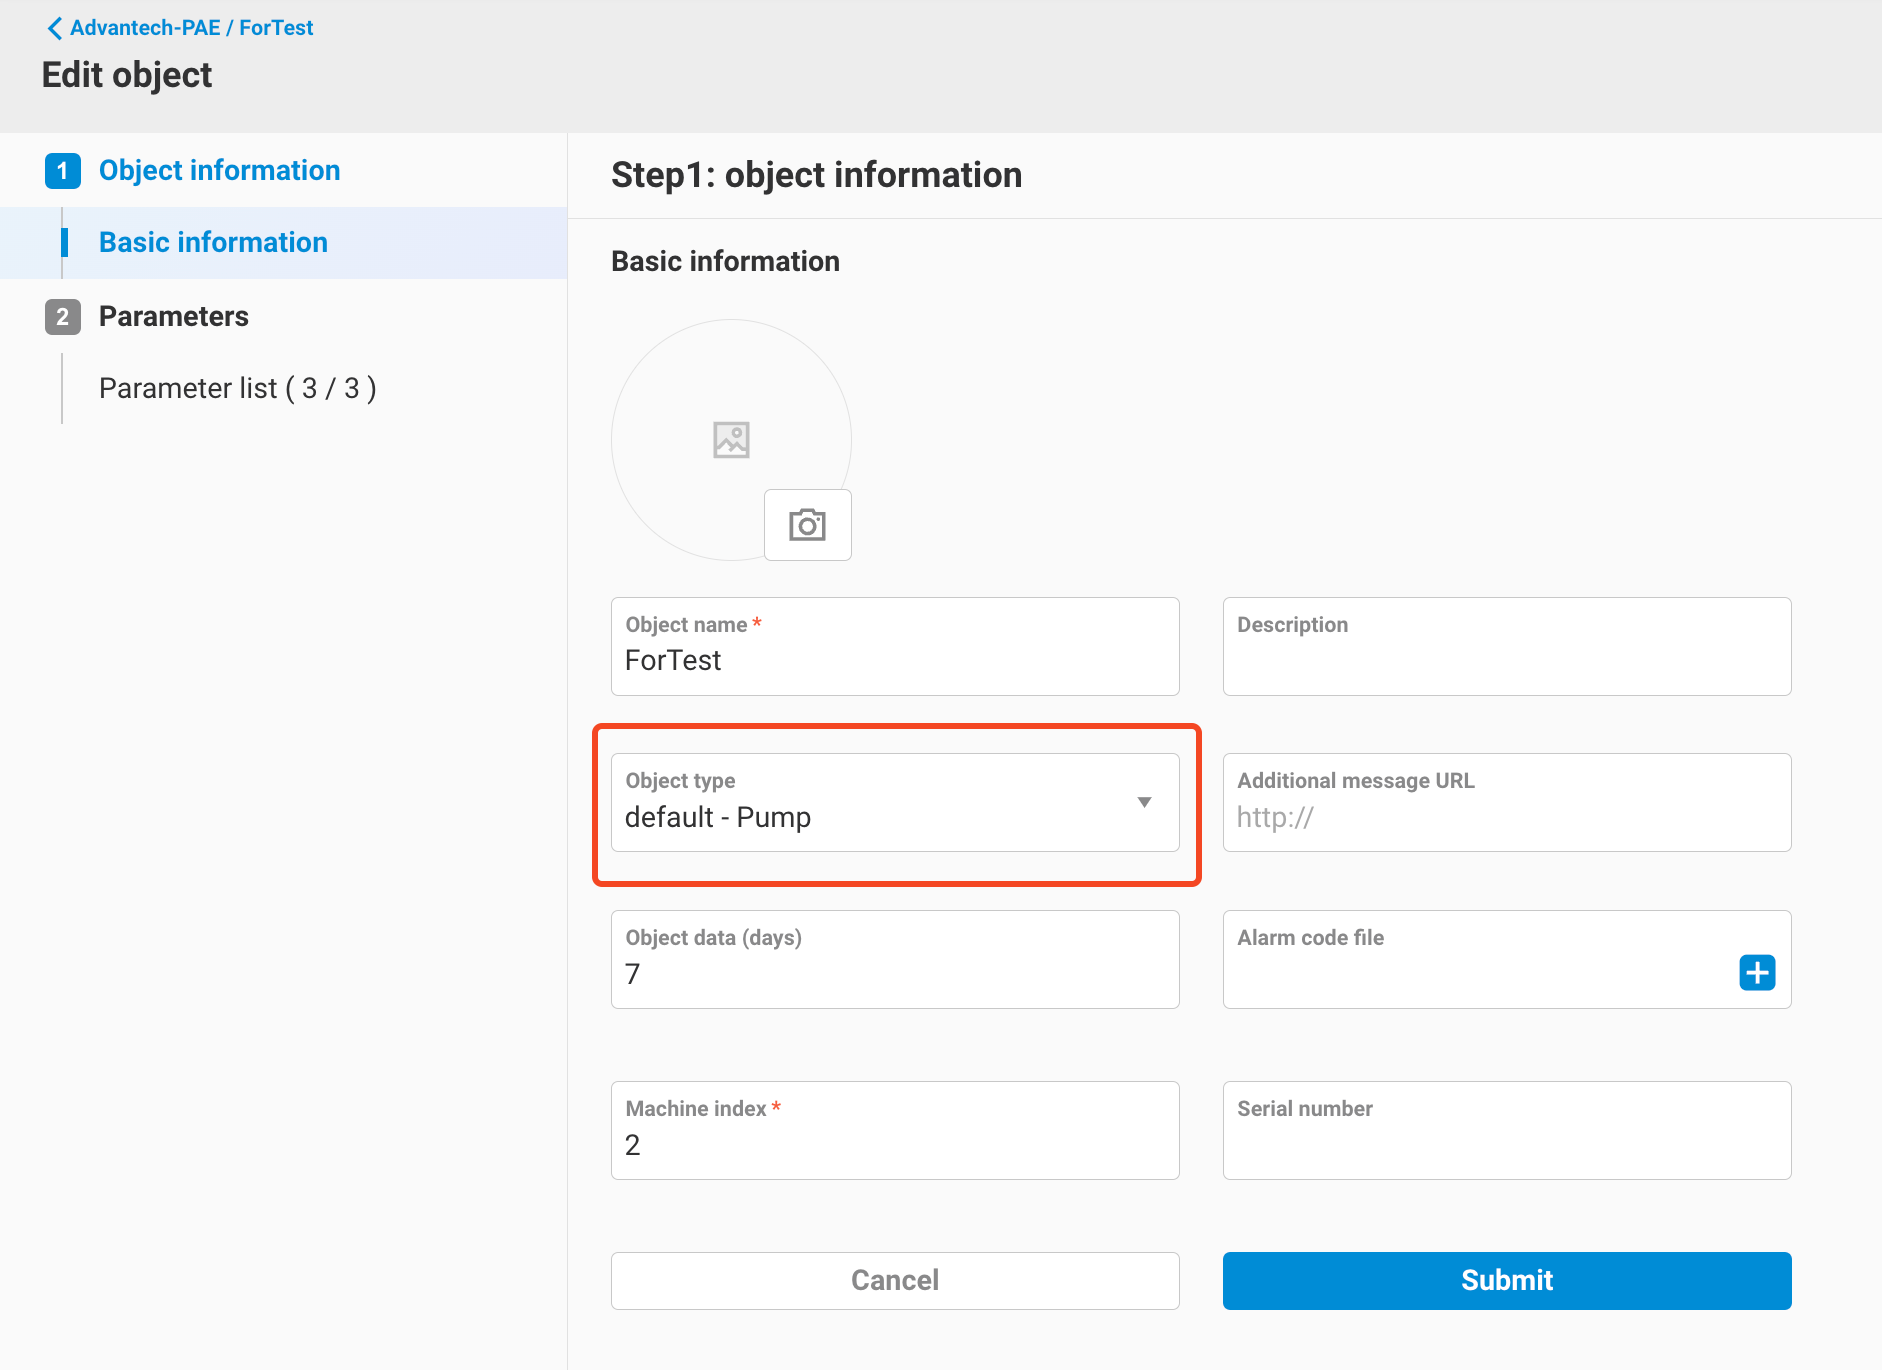
-
The EdgeHub configuration can be found in the Edge object feature.
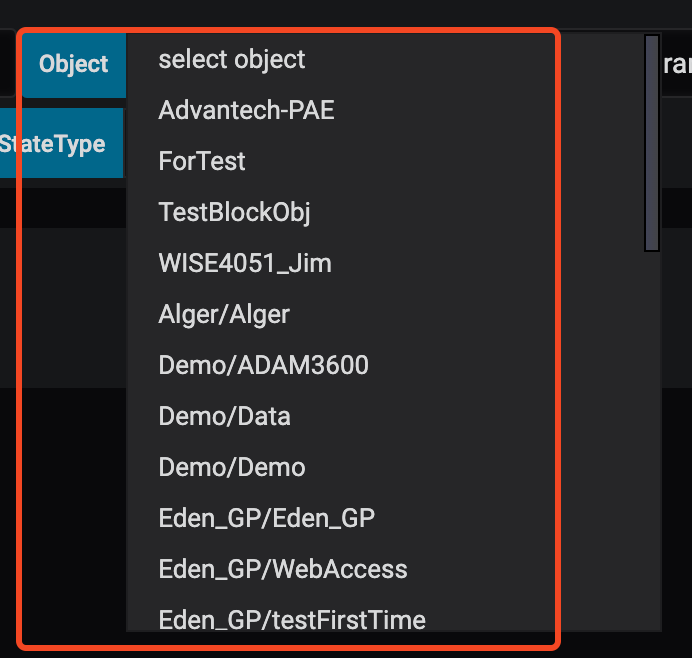
2.5 Object
Displays a list of Objects under the GroupPath, and it will also list the Objects of sub-Groups.
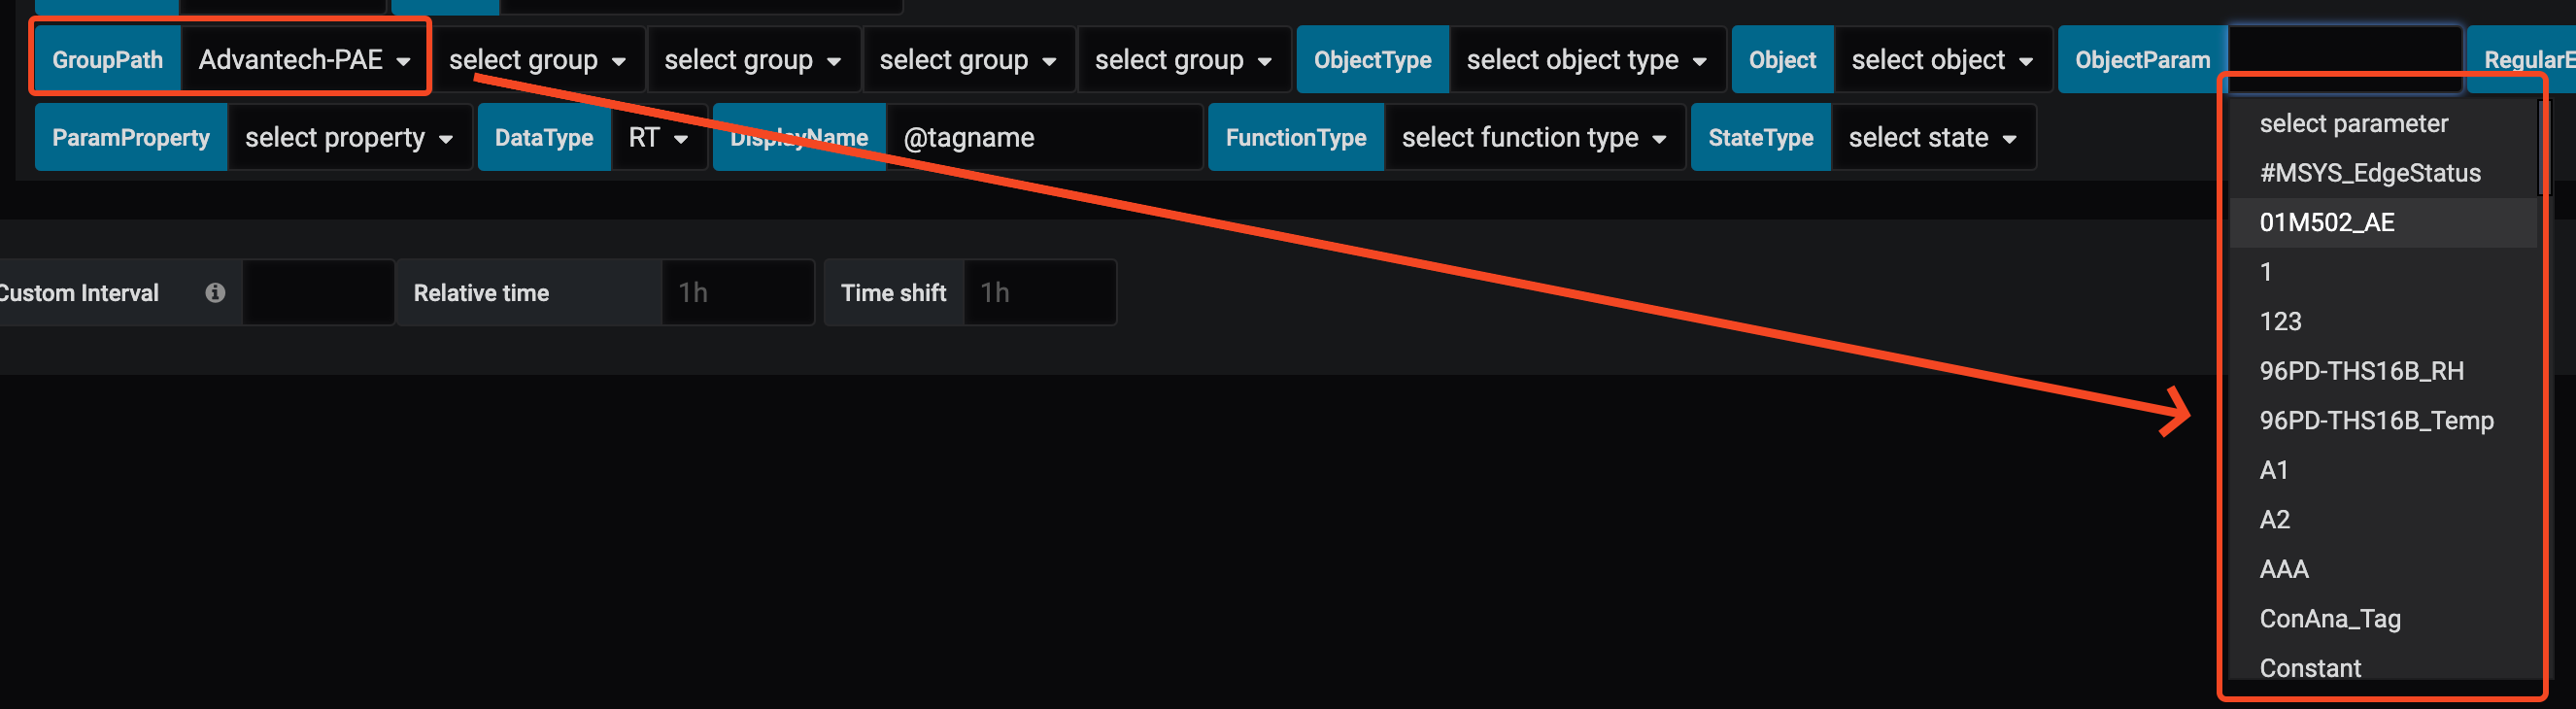
2.6 ObjectParam
Displays the parameters of the selected Object.
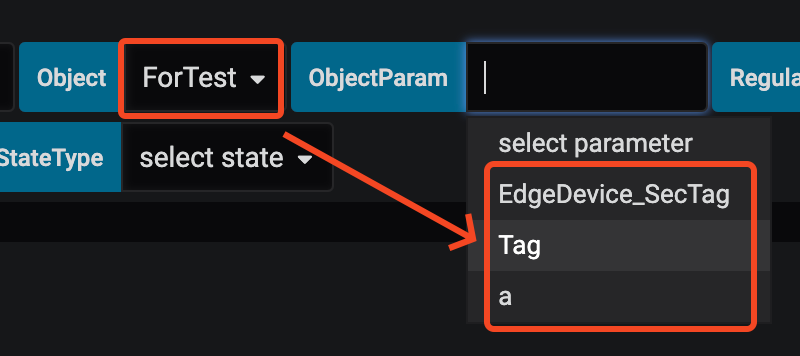
You can also choose not to select an Object and directly select ObjectParam, which will list all parameters of the Objects under the GroupPath.
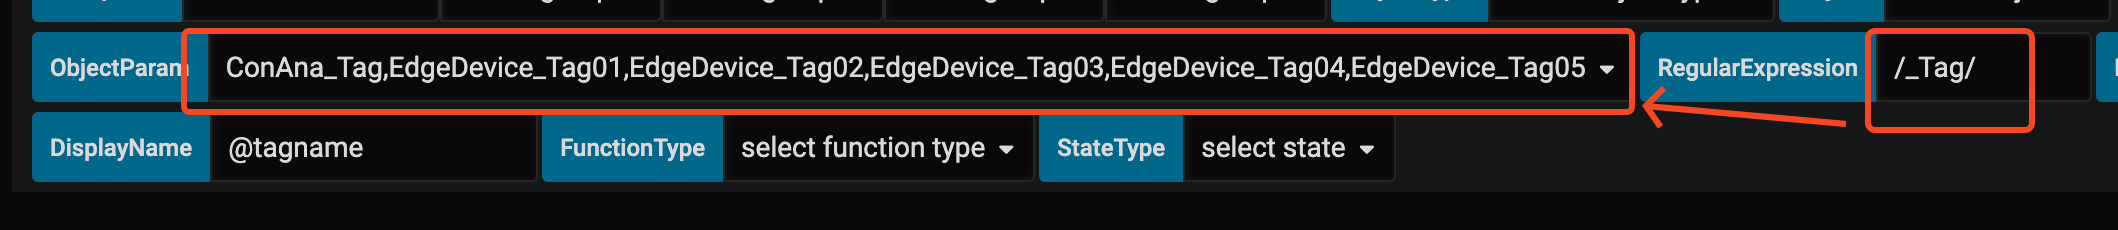
2.7 RegularExpression
Input a regular expression to filter the displayed ObjectParam list (or Tag list).
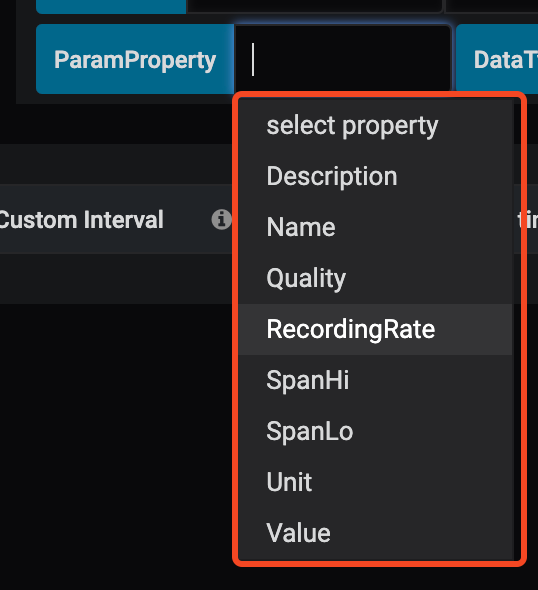
2.8 ParamProperty
Select the property to display for the currently selected parameter. The default value is Value, which is the value of the Parameter.
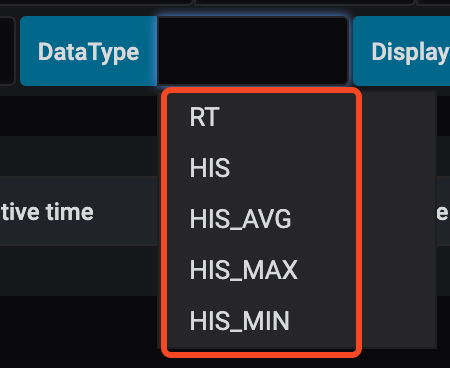
2.9 DataType
Used to query different data types:
- RT: Real-time value
- HIS: Historical data - Last value
- HIS_AVG:
- Parameter type = Current: Displays historical data - Average value
- Parameter type = Cumulative: Displays historical data - Difference
- HIS_MAX: Historical data - Maximum value
- HIS_MIN: Historical data - Minimum value
Please note that starting from EdgeHub version 2.3, Source = EdgeHub-device-management (Ref. to section 2.2) is supported, allowing users to query Device/tag data. However, the data type is limited to RT and does not support queries related to HIS/HIS_AVG/HIS_MAX/HIS_MIN.
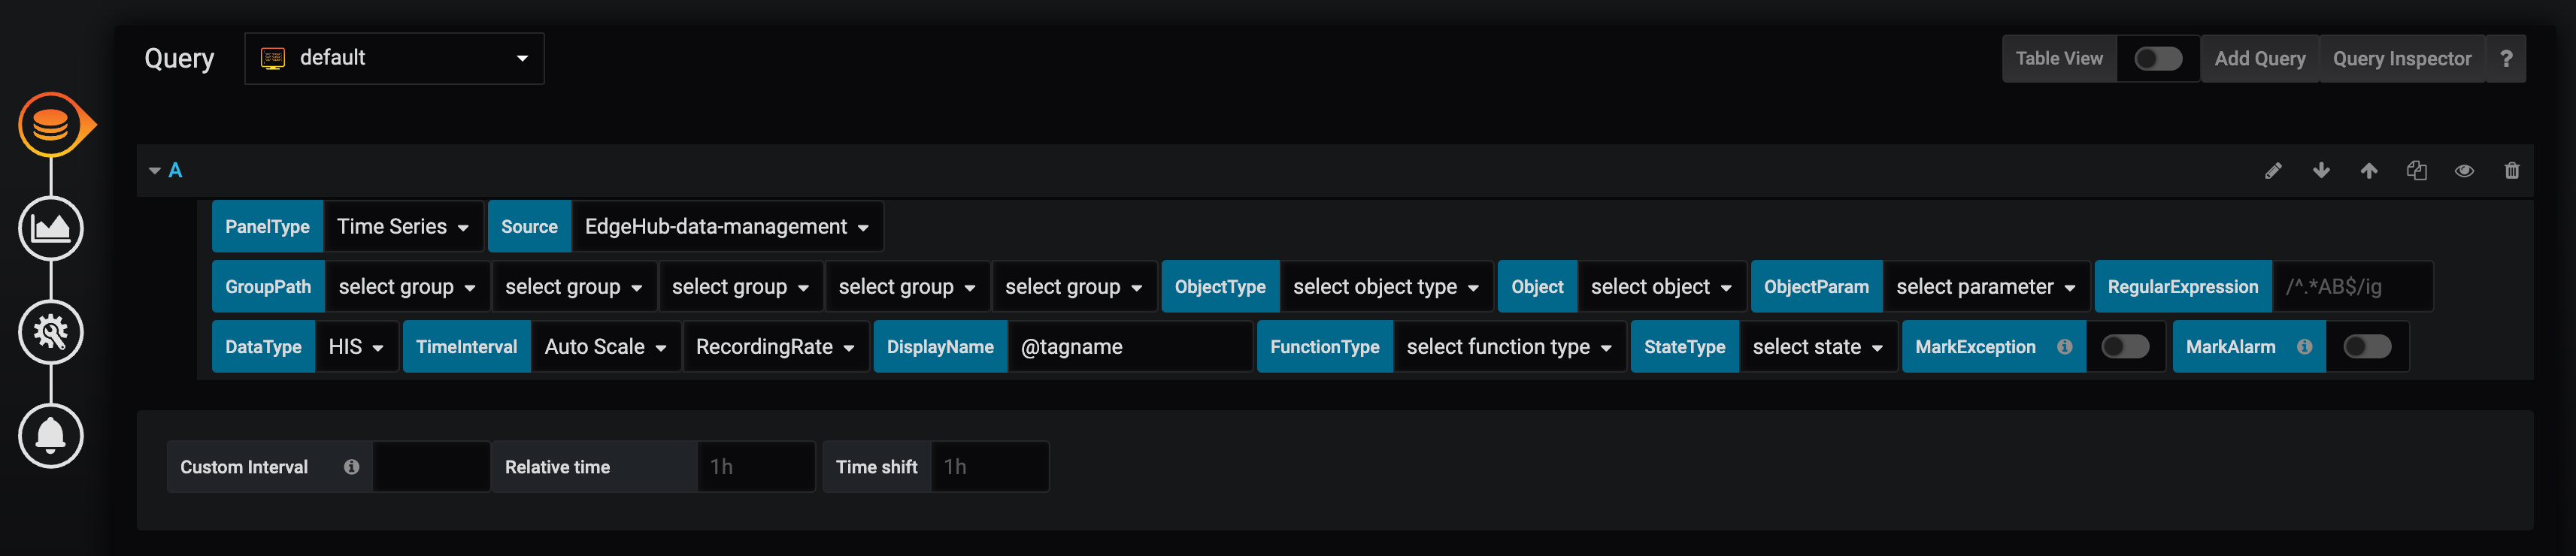
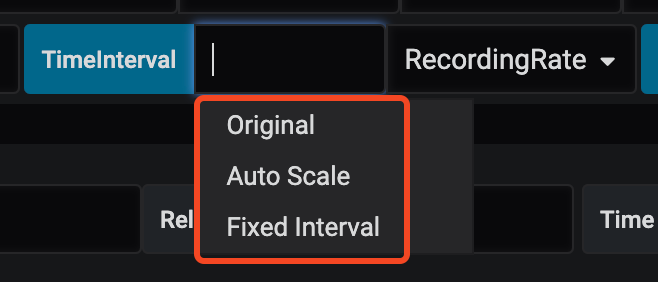
2.10 TimeInterval
This menu only appears when DataType is selected for querying HIS/HIS_AVG/HIS_MAX/HIS_MIN, used to distinguish the time interval for querying. It is divided into two sub-menus:
-
Data Scaling Mode
- Original - Directly returned from the database.
- Auto Scale - Automatically calculates the number of returned data based on screen size. The time interval between each piece of data may vary. For example, if the selected time interval is RecordingRate=1 minute, and the data query date is selected for 1 month, the system may determine that it cannot display data at a 1-minute interval due to screen size and will automatically recalculate to return data at a larger interval, such as 10-minutes.
- Fixed Interval - Users can customize the time interval for each piece of data, such as 1 min, 1 hour, etc.
-
Time Interval
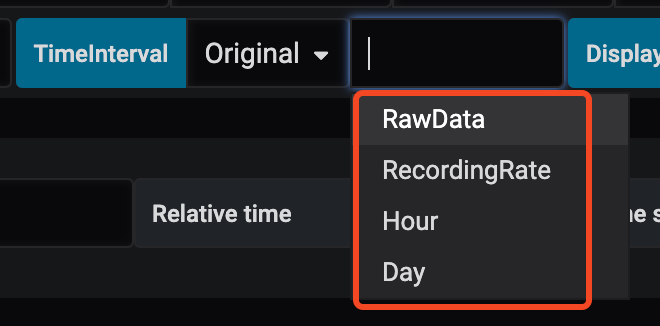
-
If the scaling mode is selected as Original, the time interval can be selected from the following data stored in the database:
- RAWData - Original data of the parameter
- RecordingRate - Saved according to the RecordingRate set for the parameter, one record per RecordingRate
- Hour - One record per hour
- Day - One record per day
-
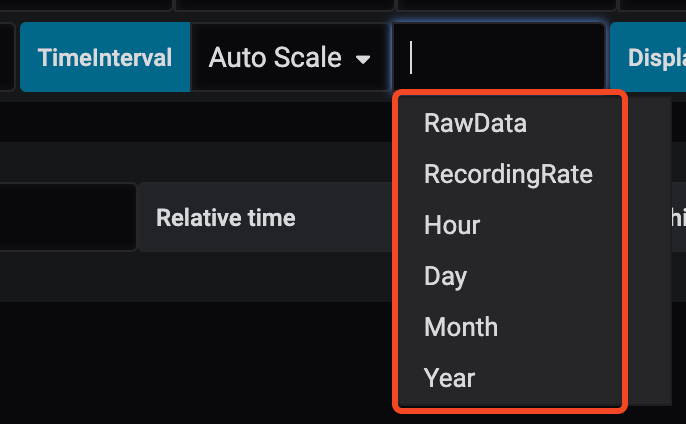
If the scaling mode is selected as AutoScale, the following modes can be selected as the base time interval, and EdgeHub will calculate a display interval that is not less than the selected interval:
- RAWData: If it can be displayed, the original data of the parameter will be shown; if not, the time interval will start increasing from the seconds level.
- RecordingRate: If it can be displayed, the parameter's RecordingRate data will be shown; if not, the time interval will start increasing from the minutes level.
- Hour: If it can be displayed, one piece of data per hour will be shown; if not, the time interval will start increasing from the hours level.
- Day: If it can be displayed, one piece of data per day will be shown; if not, the time interval will start increasing from the days level.
- Month: If it can be displayed, one piece of data per month will be shown; if not, the time interval will start increasing from the months level.
- Year: If it can be displayed, one piece of data per year will be shown; if not, the time interval will start increasing from the years level.
-
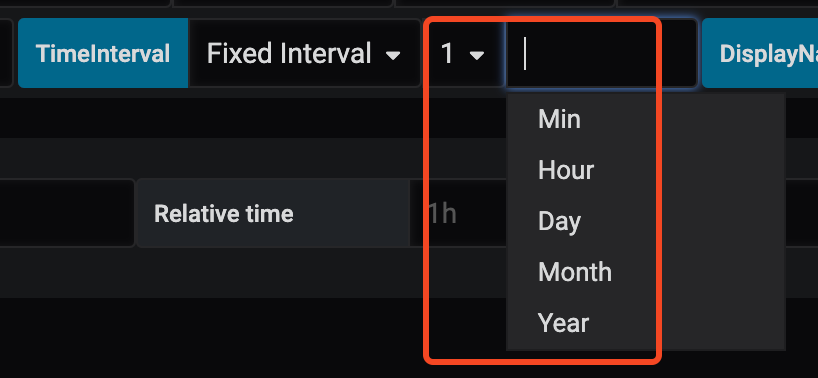
If the scaling mode is selected as Fixed Interval, the following time intervals can be chosen:
- Minutes: 1, 5, 10, 15, 20, 30
- Hour: 1, 2, 3, 4, 6, 8, 12
- Day: 1, 2, 3, 5, 7
- Month: 1, 2, 3, 6
- Year: 1
-
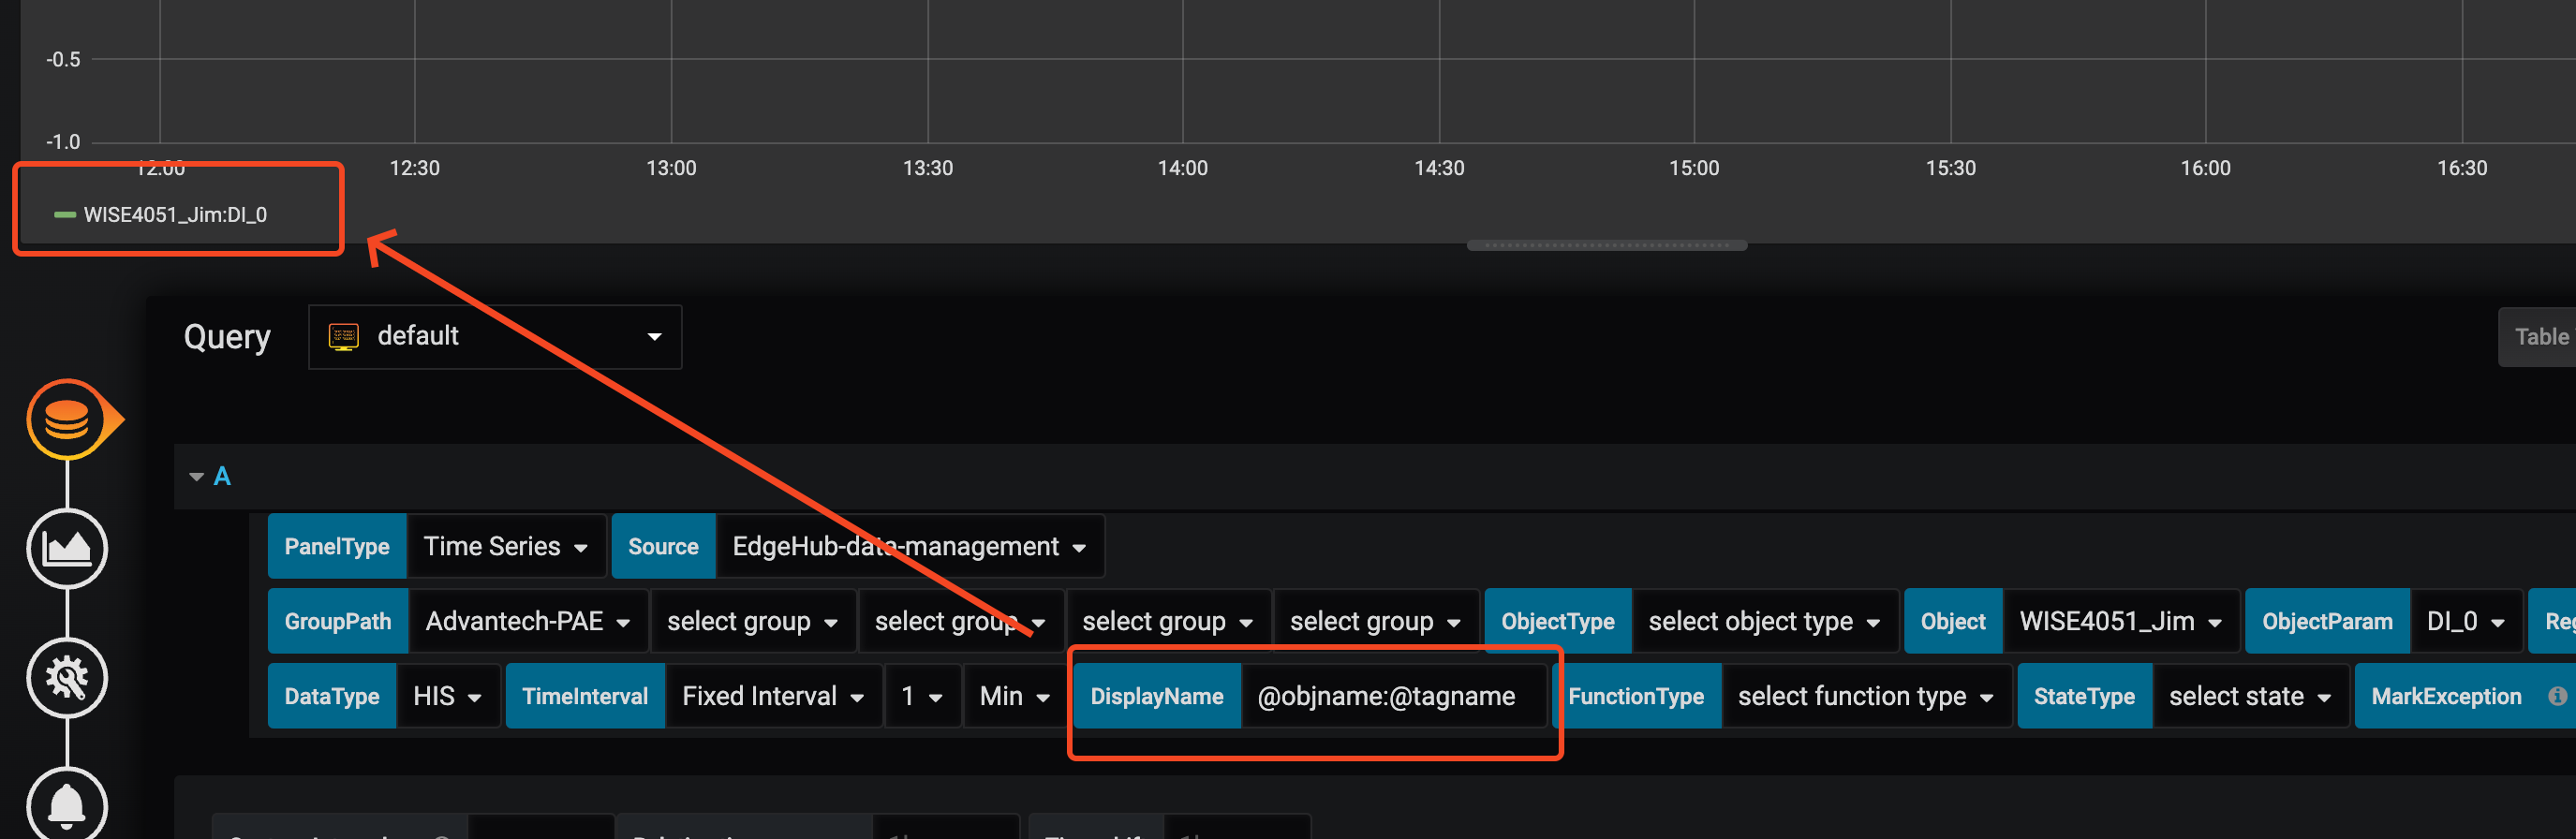
2.11 DisplayName
Used to modify the display name of the returned data. The default value is @tagname, which returns the ObjectParam name. The following built-in keywords are available for use:
- @tagname - Displays the ObjectParam name.
- @objname - Displays the name of the object where the parameter is located.
- @orgname - Displays the name of the group where the parameter is located.
- @desc - Displays the ObjectParam's description
- @unit - Displays the ObjectParam's unit
Default keywords can be combined, for example, @objname:@tagname.
Please note that if two queries are used to query different types of data for the same ObjectParam (e.g., RT + HIS), it is essential to modify the DisplayName; otherwise, the panel cannot draw data with the same name.
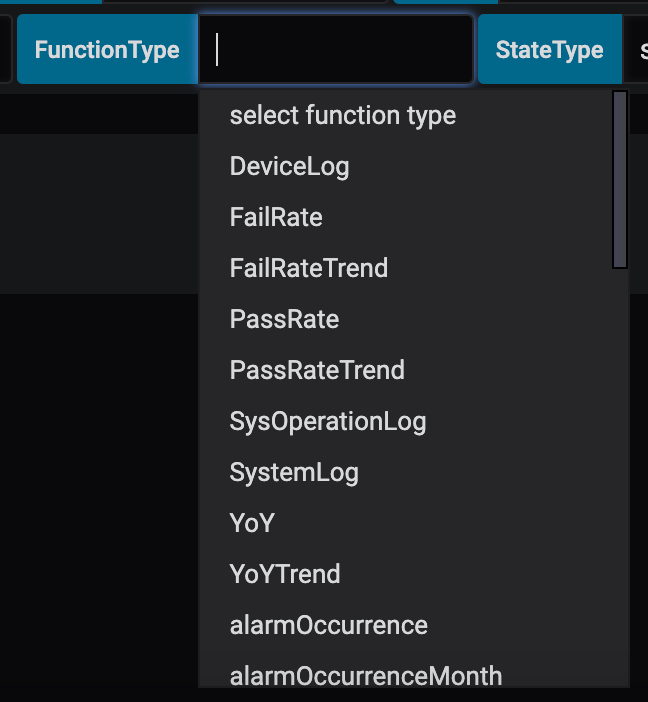
2.12 FunctionType
Various calculation functions provided by EdgeHub. Please refer to the article Datasource functions for more details.
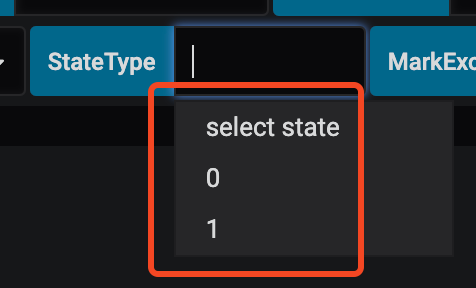
2.13 StateType
Used in conjunction with certain specific FunctionTypes. When the function needs to select the state of a discrete parameter, select it through this menu.
2.14 MarkException
This setting is used to indicate whether there are any data points with bad quality in the historical data. When this option is unchecked, the chart displays a continuous line regardless of the data quality. However, when the option is checked, the chart will break the line at points where data has bad quality, and it will insert special markers at those points. These special markers can be displayed using the Group Bar Chart Panel.

2.15 MarkAlarm
This setting is used to display whether the current parameter has triggered any alarms (including both real-time and historical alarms) on the historical trend chart. If an alarm has occurred, a special marker will be displayed at the corresponding point on the chart. These special markers can be displayed using the Group Bar Chart Panel.

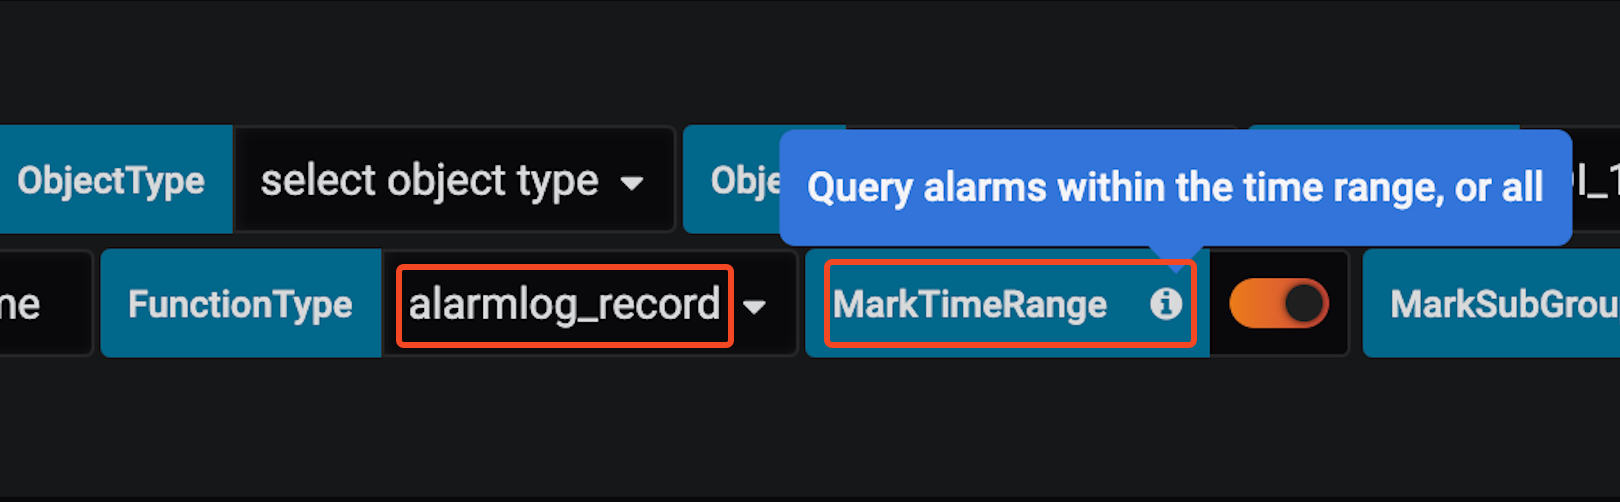
2.16 MarkTimeRange
This option will appear when alarm_record is selected as the FunctionType, and it is used to determine how to query real-time alarm records:
- Enabled: Query according to the Time Range selected on the Dashboard.
- Disabled (default): Query all currently active real-time alarms.
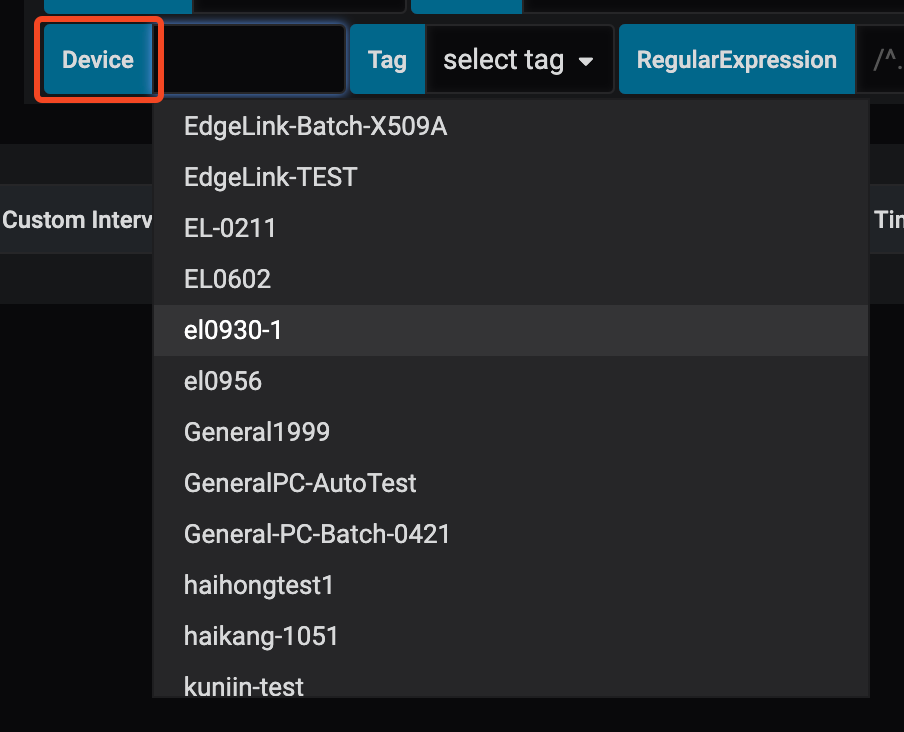
2.17 Device
This field setting is displayed only when Source = EdgeHub-device-management (Ref. to section 2.2).
It shows the list of Devices under the corresponding Tenant. Please select the Device to query.
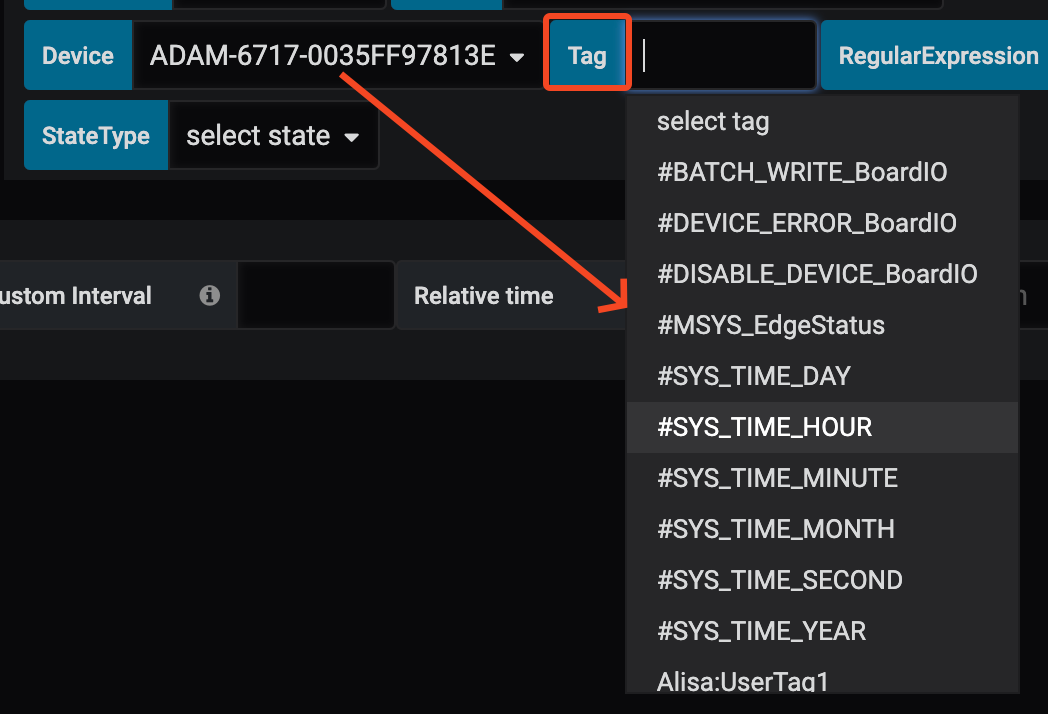
2.18 Tag
This field setting is displayed only when Source = EdgeHub-device-management (Ref. to section 2.2).
It shows the list of Tags for the selected Device. Please select the Tag to query.
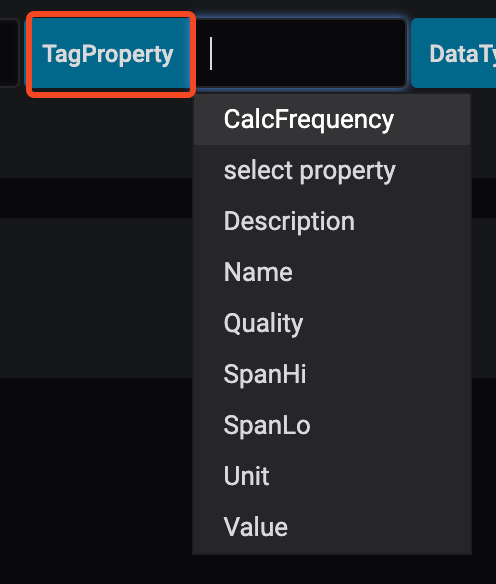
2.19 TagProperty
This field setting is displayed only when Source = EdgeHub-device-management (Ref. to section 2.2).
Similar to section 2.8, this allows selecting the properties of the currently selected Tag. The default value is Value, which represents the value of the Tag.