Overview
This overview feature enables users to quickly view the periodic entry and exit statistics of each people-counting unit. The data can be presented in either a list or chart format, enhancing the efficiency of analysis and comparison.
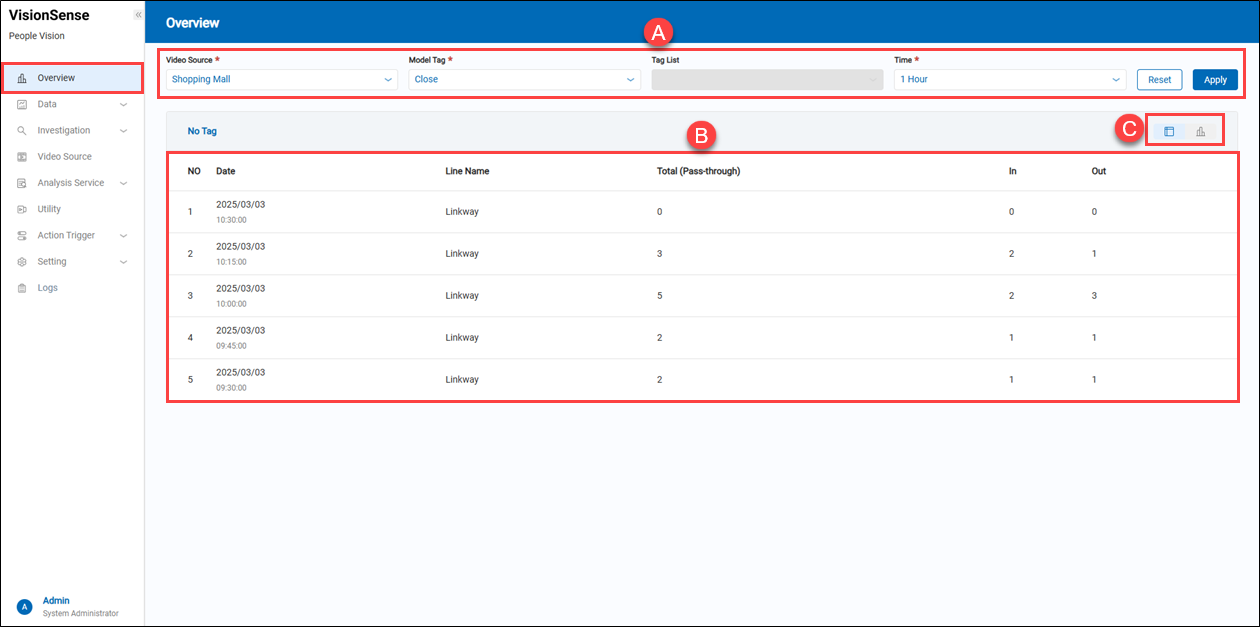 A.【Filtering】 ⇒ Users can use this filter function to view the people-counting statistical data, as described below.
- Video Source: Users can select which video source(IP cameras) to view.
- Model Tag: There are three options available: 'Close,' 'Contain Tags,' and 'Exclude Tags.' These options are associated with the 'Tags List' condition.
- Tag List: Based on the AI model, some object tags can be identified, but for the current people-counting unit, this condition is not needed.
- Time: If the time period is set to one day, the statistical data is displayed hourly. If set to one hour, the data is displayed every 15 minutes.
- Reset & Apply: Click the 'Apply' to apply the filter conditions or click the 'Reset' to reset them.
> Reamrk If the time period is set to one day, the statistics will be listed at hourly intervals. If the time period is set to one hour, the statistics will be listed at 15-minute intervals.
B.【Data】 ⇒ The people-counting data for the day can be displayed based on different video sources.
- Date: Display a one-day period.
- Line Name: Display the people-counting unit's name.
- Total(Pass-through): This stistical number is the sum of the 'Entry' and 'Exit' statistics.
- In / Out: Display the 'In' (Entry) and 'Out' (Exit) statistics within the period.
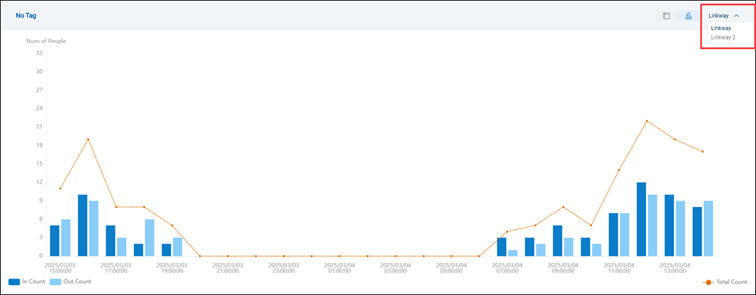
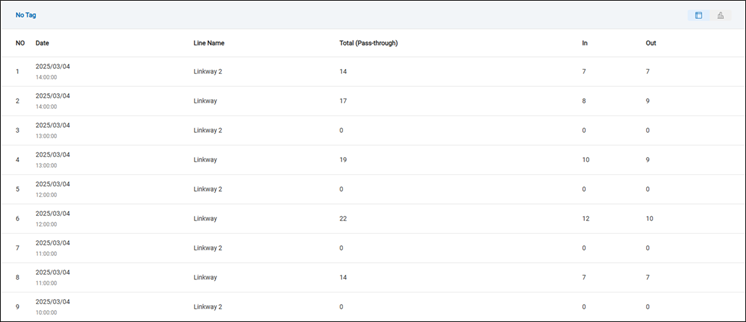
C.【Display Mode Selection】 ⇒ Two types of customer traffic statistical display modes are provided, as described below:
-
List Mode: Click the
 'list mode' to display the entry and exit statistics of each people-counting unit.
-
Bar Chart Mode: Click the
 'bar chart mode' to display the entry, exit and total statistics for each people-counting unit. In this mode, different people-counting units can be selected.