Analysis Service
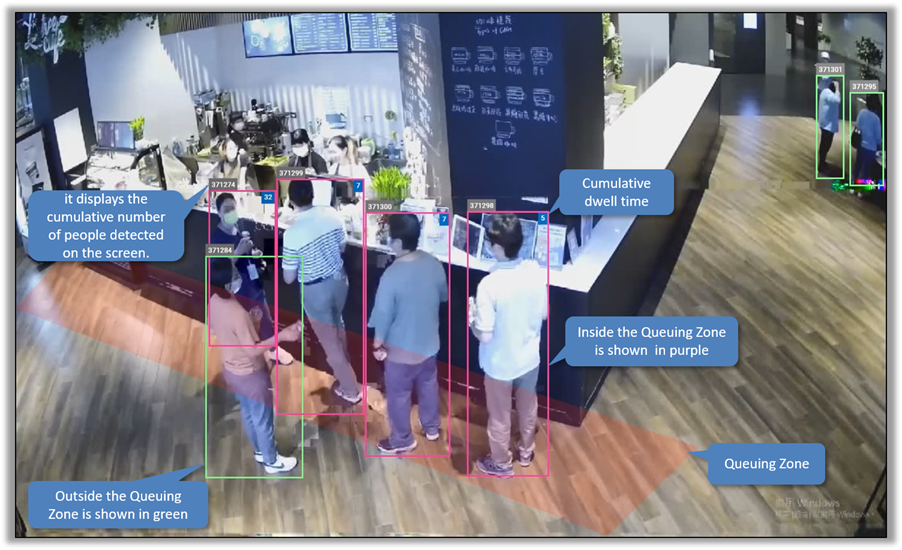
The ‘Detection Display’ feature allows users to view live video streams with real-time analysis units. The system provides two analysis units: queuing and people counting. Users can view the queuing zone, cumulative number of detected objects, and dwell time calculation for each person through the queuing analysis unit. For people counting, users can view the footfall data. Additionally, users can view multiple analysis units by adding different video source.
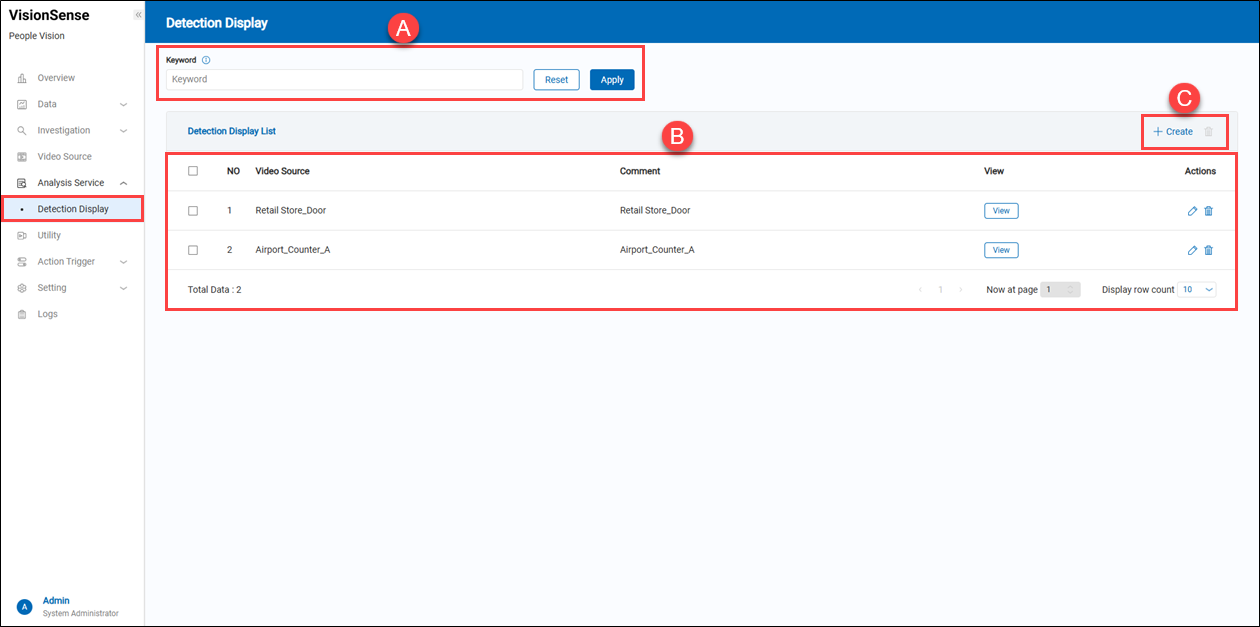 A.【Filtering】 ⇒ Users can quickly search for a people-counting unit's name by keyword.
B.【Detection Display List】
A.【Filtering】 ⇒ Users can quickly search for a people-counting unit's name by keyword.
B.【Detection Display List】
- Video Source: It displays which video source this real-time "Detection Display" belongs to.
- Comment: It displays user-defined ‘Detection Display’ name.
- View: Click the
 'View' to pop up a browser to see real-time video with a counting unit.
 - Action: Click the
 'Edit' to enter the edit page or click the
  'Delete' to delete the assigned data.
C.【+ Create/Delete】 ⇒ Users can click ![]() '+ Create' to add a Detection Display and click
'+ Create' to add a Detection Display and click ![]() 'Delete' to remove multiple Detection Display at a time. To create a new detection display, see below.
'Delete' to remove multiple Detection Display at a time. To create a new detection display, see below.
【Create Detection Display】
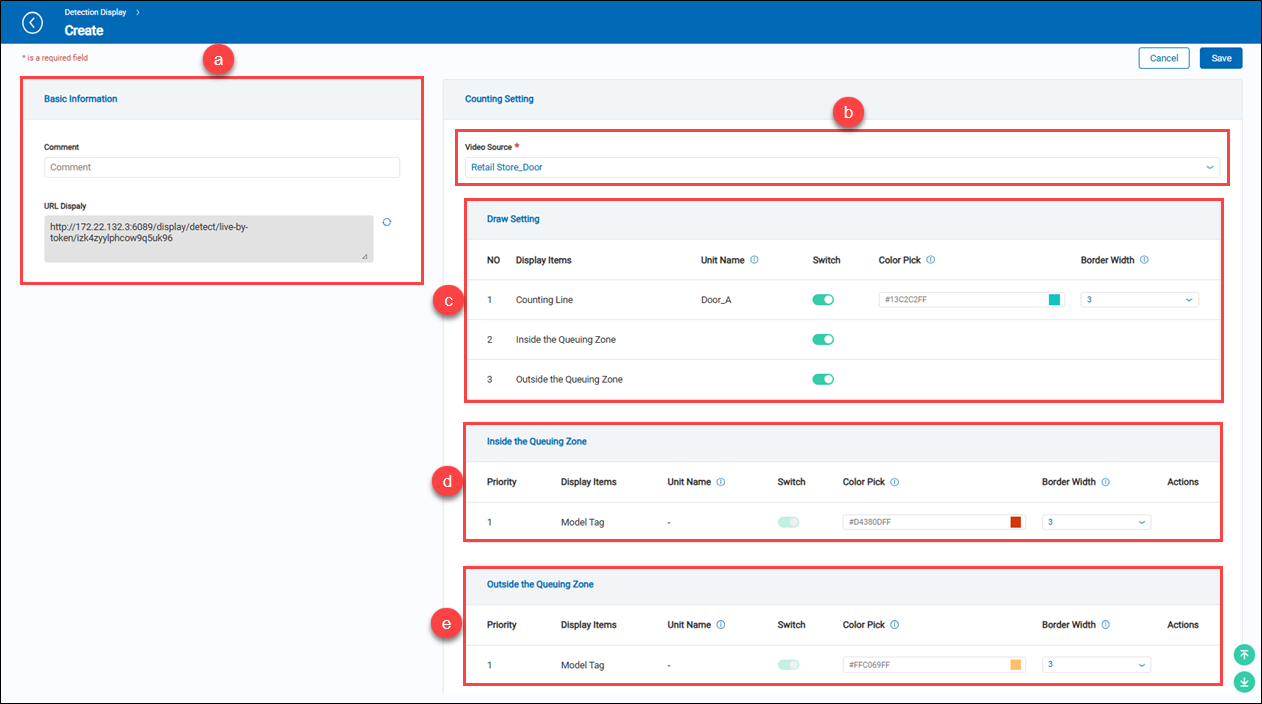 a.【Basic Information】
- Comment: Users can input any string for notes.
- URL Display: It is automatically generated by the system. To view real-time live video with an analysis unit, paste this URL into a browser.
b.【Counting Setting】 ⇒ A list of video source options to select which one to browse. c.【Draw Setting】 ⇒ These settings are used for displaying the visible detection line and zone.
- Display Items: Shows the counting unit type.
- Unit Name: Shows the name of the added counting unit of the analysis unit.
- Switch: Display the counting unit and human-detected boxes by turning on the switch.
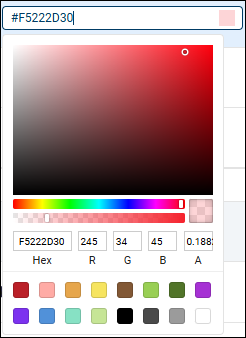
- Color Pick: Provide a palette to change the color of the counting unit.
- Border Width: Adjust the line border width of the counting unit.
d.【Inside the Queuing Zone】 ⇒ Adjust the color and line width of the human-detected boxes inside the zone.
- Priority: The recognition priority of the model tags.
- Display Items: System reserved.
- Unit Name: System reserved.
- Switch: System reserved.
- Color Pick: Provide a palette to change the color of the counting unit.
- Border Width: Adjust the line border width of the counting unit.
- Action: Reserved for further use.
e.【Outside the Queuing Zone】 ⇒ Adjust the color and line width of the human-detected boxes outside the zone.
- Priority: The recognition priority of the model tags.
- Display Items: System reserved.
- Unit Name: System reserved.
- Switch: System reserved.
- Color Pick: Provide a palette to change the color of the counting unit.
- Border Width: Adjust the line border width of the counting unit.
- Action: Reserved for further use.
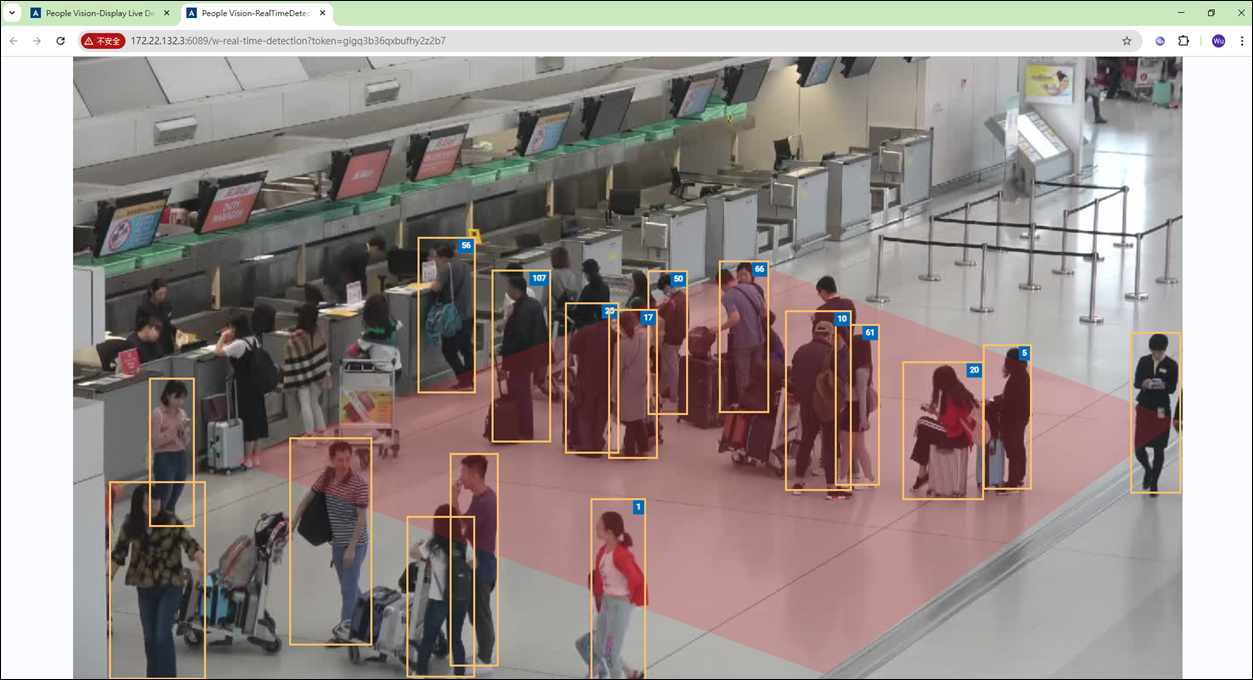
Demonstration of the Counting Line and Queuing Zone
As mentioned, click the 'view' to pop up a browser to display live analysis.
【Counting Line】
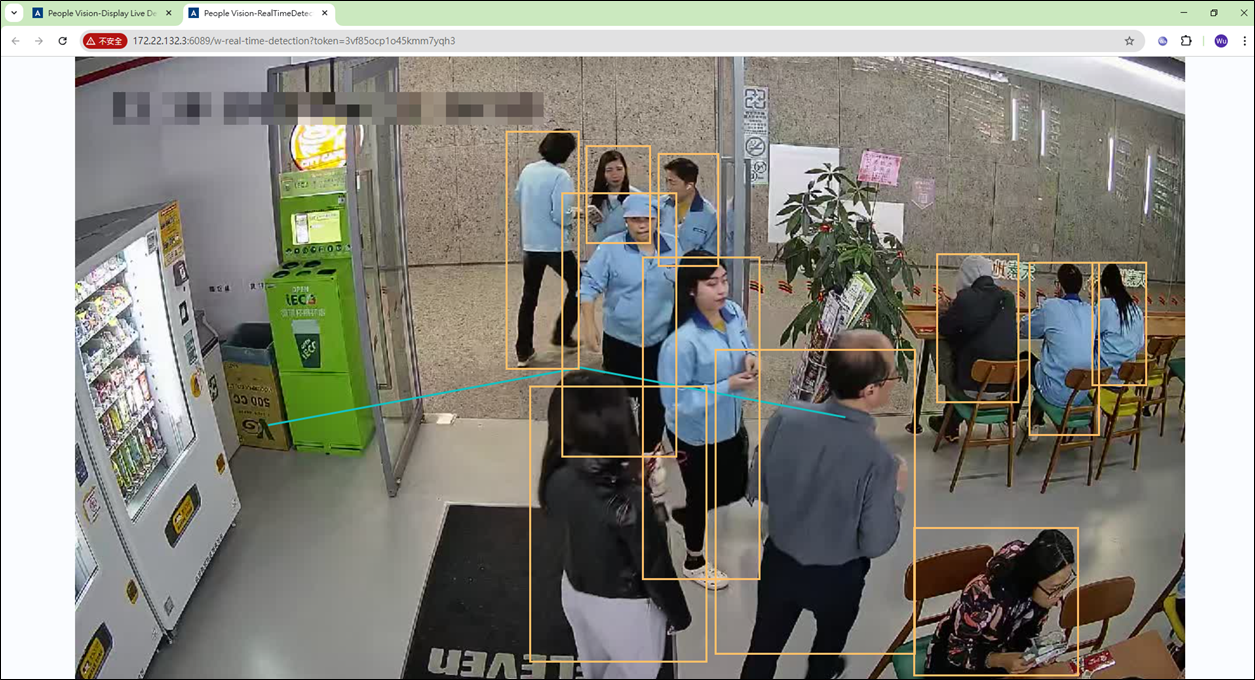
【Queuing Zone】