Overview
This manual primarily introduces Advantech's WISE-iService《CountingBI》service, which helps relevant personnel quickly understand the key metrics in customer traffic analysis and POS data. The goal is to compare in-store customer traffic with sales performance. By integrating customer traffic data (such as the number of visitors, dwell time, etc.) with POS system sales data (such as the number of transactions, average transaction value, etc.), conversion rates, customer behavior patterns, and efficiency can be measured. This allows for the further optimization of operational strategies and improves sales performance.
Product Overview
The WISE-iService《CountingBI》service primarily offers the following features:
- Data Overview: Provides key metrics such as total revenue, number of transactions, number of visitors, and average transaction value on a daily, weekly, monthly, and yearly basis. With these statistics, users can monitor the operational status of each branch in real time.
- Notification Center: The "Notification Center" page is designed to consolidate all alarm notifications triggered when the queue count exceeds the set limit. Whenever the system detects that the queue number surpasses the threshold, the page automatically receives and displays the relevant alarm notifications. Users can easily view detailed information about each alarm, including the trigger time, queue number, and alarm status, helping them stay informed about the system status and take appropriate actions.
- Cross-Sites Analysis: Allows users to view statistics and trends across different locations using five key metrics: number of visitors, revenue, number of transactions, conversion rate, and average transaction value.
- Single-Site Analysis: Displays the relationship between customer traffic and revenue from the perspective of a single site. The single-site KPI review function offers detailed metric analysis, helping users evaluate the store's performance.
- Queuing Management: The queuing management function enables administrators to monitor and manage queuing situations in real time. It also displays whether the venue is currently crowded, helping managers respond more flexibly to peak customer traffic.
- Data Report: Marketing and customer traffic reports are presented based on daily, weekly, monthly, and yearly periods. Weekly operational reports can also be sent to designated personnel.
- Settings: Configuration of two statistical units, namely traffic and queue, as well as weekly report delivery settings. The "System Settings" page provides users with various features, including configuration options for traffic and queue statistical units and the ability to set up weekly report delivery. Additionally, users can configure rules for sending notifications via Line or WhatsApp to receive real-time alerts when queue numbers reach their peak.
- Integrations: Provides a data connection management channel for Microsoft Power BI, enabling Power BI to obtain various statistical data from the Counting BI service.
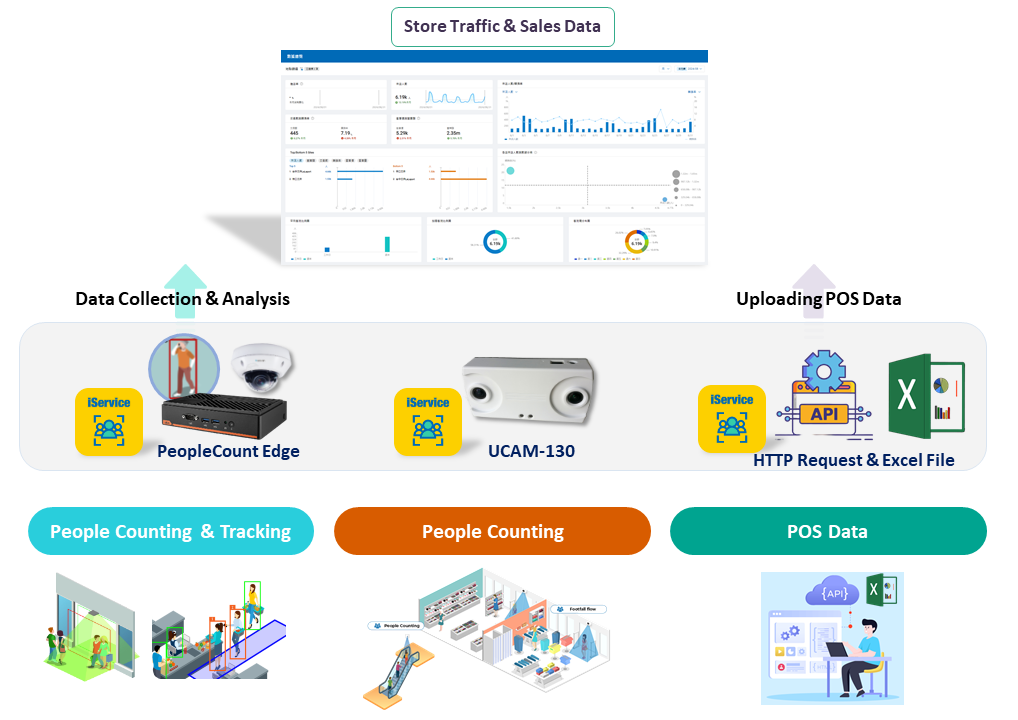
> Note: The《CountingBI》service only receives customer traffic data and POS data, and it processes and analyzes these data. The sources of customer traffic and POS data are as follows:
- Footfall Data Sources: UCAM-130 3D traffic camera, VisionSense (with IP cameras).
- Queuing Data Sources: iVision Suite Edge Server (with IP cameras).
- Marketing Data Sources: There are two methods for importing POS data via API or through Excel files containing marketing data.
Product Information
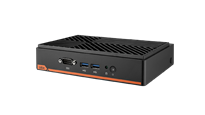
【iVision Suite Edge Server UBX-330】
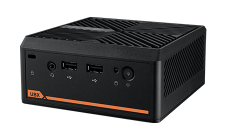
【iVision Suite Edge Server UBX-110H】
【Footfall 3D Camera UCAM-130 (Legcy Product)】

【Operational Structure】