Site Ranking
In this ranking chart, users can view site statistics and trends across five different metrics: “Traffic,” “Sales,” “Transaction,” “Conversion Rate,” and “Average Transaction Value.” After selecting a metric, the chart displays the trend as a line graph over time periods, including daily, weekly, monthly, and yearly intervals, clearly illustrating changes over time. Additionally, based on the different metrics, the system ranks the operational performance of each site, helping users quickly understand the relative performance of each site across various metrics and make more targeted business decisions.
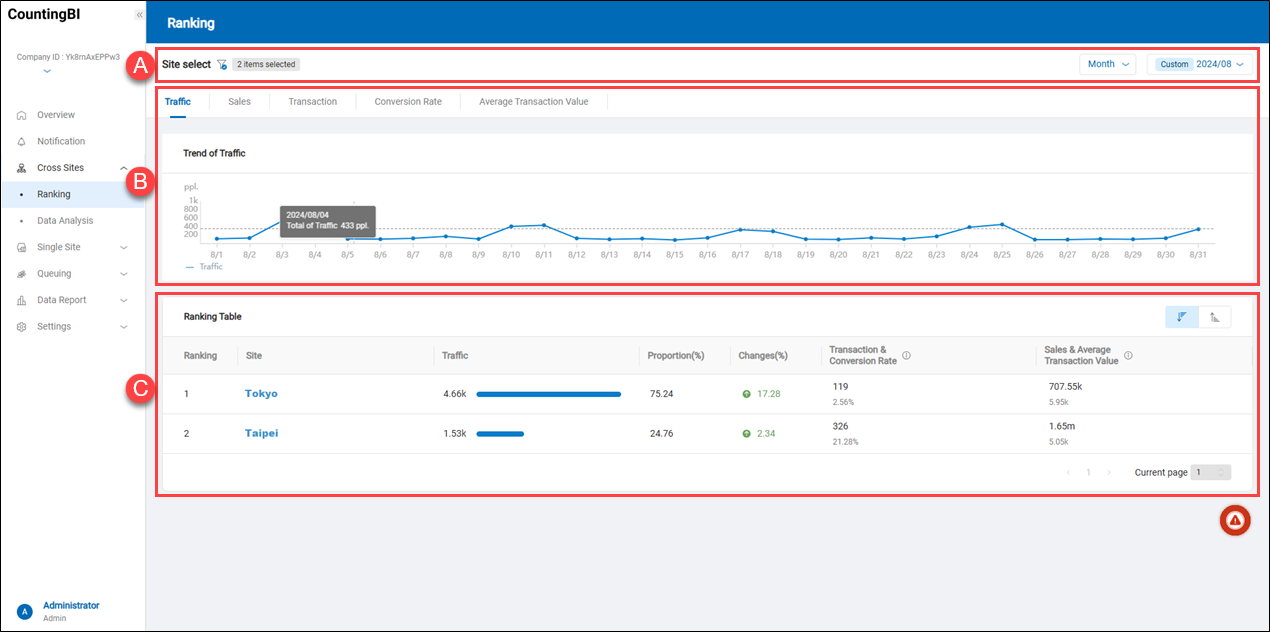 A.【Site Select】 ⇒ Click the filter icon
 ![]() to filter sites by country/region, region, site region, site type, or site name. This filter works with daily, weekly, monthly, and yearly time periods to display statistical data accordingly.
to filter sites by country/region, region, site region, site type, or site name. This filter works with daily, weekly, monthly, and yearly time periods to display statistical data accordingly.
B.【Trends Chart for Five Key Metrics】 ⇒ This chart displays a comparative view of five metrics—“Traffic,” “Sales,” “Transaction,” “Conversion Rate,” and “Average Transaction Value” — summarized across four time periods.
> Note: The smallest time display unit is “hour” (applicable to daily statistics), while the largest is “month” (applicable to yearly statistics).
C.【Ranking Table】 ⇒ The rankings dynamically adjust based on the selected metric in the trends chart, providing a ranked view of site by that metric. The ranking list can be displayed in ascending or descending order. By clicking on a specific site in the rankings, users are directed to the "Data Analysis" page within the "Single Site Analysis" feature, where a more detailed statistical analysis is available for that site.
Data Analysys
This section provides two types of trend analysis charts: “Cross-Sites Trend Analysis” and “Cross-Sites Average Analysis.” Users can review trend analyses for various sites using five key metrics — “Traffic,” “Sales,” “Transaction,” “Conversion Rate,” and “Average Transaction Value”—along with daily, weekly, monthly, and yearly time periods.
For example, with the "number of visitors" metric, the rankings display each site’s "total number of visitors," "visitor count as a percentage of the total," and "change in visitor numbers compared to the previous period" for the selected time period. If integrated with POS sales data, the analysis also includes statistical data on the relative relationship among conversion rate, revenue, and average transaction value.
>Notes:
- If the time period is set to “day,” the “Cross-Sites Daily Trend Analysis” chart displays hourly trends for that day, while the “Cross-Sites Last 7-Day Average Analysis” chart shows the average hourly trend over the past seven days.
- If the time period is set to “week,” the “Cross-Sites Weekly Trend Analysis” chart shows daily trends for the current week, and the “Cross-Sites Last 4-Week Average Analysis” chart shows the average daily trend over the past four weeks.
- If the time period is set to “month,” the “Cross-Sites Monthly Trend Analysis” chart shows daily trends for the current month, and the “Cross-Sites Last 3-Month Average Analysis” chart shows the average daily trend over the past three months.
- If the time period is set to “year,” the “Cross-Sites Yearly Trend Analysis” chart shows monthly trends for the current year, while the “Cross-Sites Last 3-Year Average Analysis” chart shows the average monthly trend over the past three years.
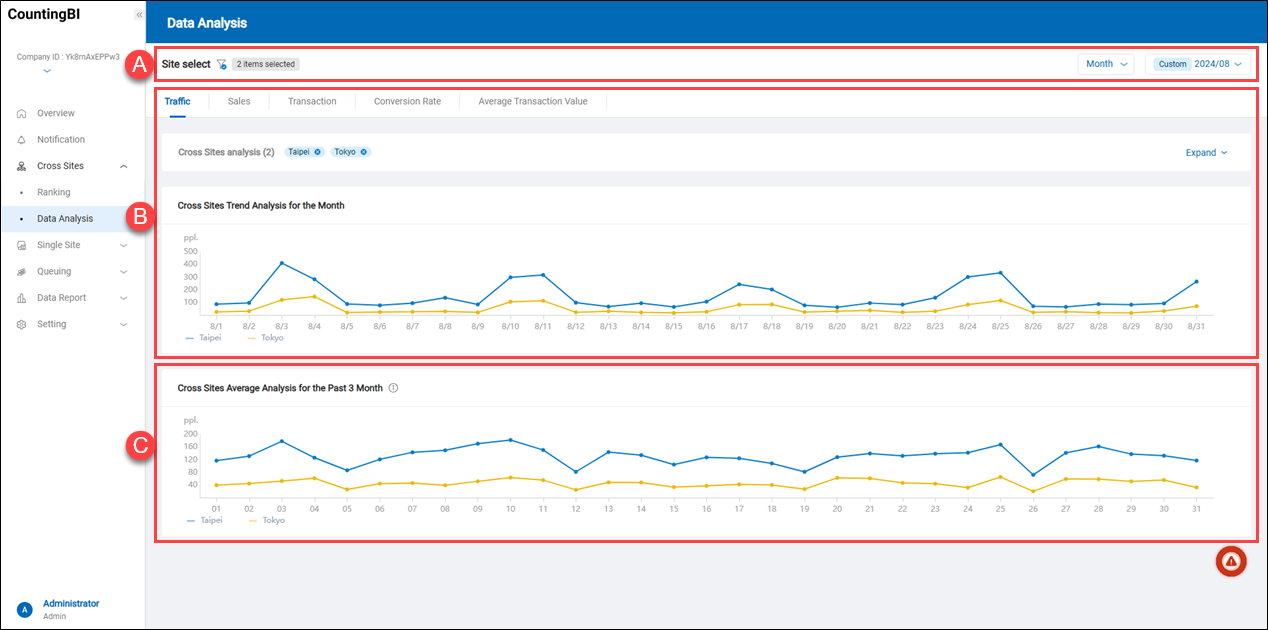 A.【Site Select】 ⇒ Click the filter icon
 ![]() to filter sites by country/region, region, site region, site type, or site name, and display statistical data with daily, weekly, monthly, or yearly time periods.
to filter sites by country/region, region, site region, site type, or site name, and display statistical data with daily, weekly, monthly, or yearly time periods.
B.【Trend Analysis for Five Key Metrics】 ⇒ This chart displays a trend analysis of multiple sites across four time periods for five metrics: “Traffic,” “Sales,” “Transaction,” “Conversion Rate,” and “Average Transaction Value.”
> Note: The smallest time display unit is “hour” (applicable to daily statistics), while the largest is “month” (applicable to yearly statistics).
C.【Average Analysis for Five Key Metrics】 ⇒ This chart provides an average analysis of the five metrics—“Traffic,” “Sales,” “Transaction,” “Conversion Rate,” and “Average Transaction Value”—based on four comparative time periods, showing the average performance across sites for the last three cycles.