KPI Review
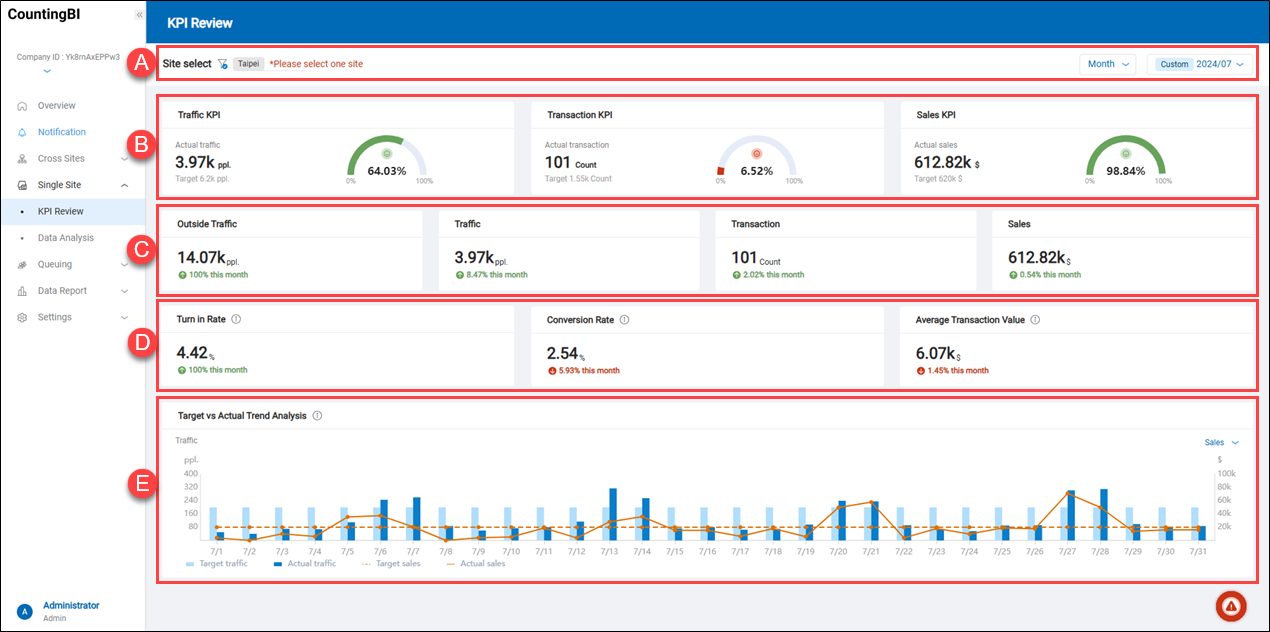
The KPI review function for individual sites provides a detailed analysis of key metrics based on the relationship between customer traffic and revenue. This feature helps users evaluate site performance by analyzing changes in customer traffic relative to corresponding revenue growth, allowing them to assess the site's effectiveness in attracting customers and converting sales. Users can examine whether the site is meeting its predetermined KPI targets based on the interplay between these two key indicators and make adjustments and optimizations as needed. This ensures the effectiveness of business strategies and supports continuous improvement.
 A.【Site Select】 ⇒ Click the filter icon
 ![]() to filter sites by country/region, region, site region, site type, or site name, and display statistical data for daily, weekly, monthly, or yearly time periods.
to filter sites by country/region, region, site region, site type, or site name, and display statistical data for daily, weekly, monthly, or yearly time periods.
B.【Traffic KPI / Transaction KPI / Sales KPI】 ⇒ These three KPI charts together provide clear data support for site operations, enabling managers to effectively monitor site performance.
-
Traffic KPI: This chart shows the actual number of visitors to the site compared with the targeted visitor count. It provides users with visitor trend data, helping to evaluate changes in actual visitor numbers and the achievement rate of the KPI.
-
Transaction KPI: This chart displays the actual number of transactions compared with the targeted transaction count. It provides users with transaction trend data, assisting in assessing changes in the actual transaction count and the KPI achievement rate.
-
Sales KPI: This chart shows the site’s actual revenue compared with the targeted revenue. It provides users with revenue trend data, supporting the evaluation of changes in actual revenue and the achievement rate of the KPI.
C.【Visitor Traffic / Transaction Count / Sales Changes】 ⇒ These four metrics are interconnected, forming a complete data chain for site operations: from potential customer traffic outside the site to the attraction of in-site visitors, then to the conversion rate of transactions, ultimately impacting revenue levels.
-
Outside Traffic: This metric counts the number of potential customers passing by outside the site, reflecting the foot traffic in the site’s surrounding area. If analyzed on a monthly basis, it shows the rate of change between last month’s and this month’s data. This is an important reference point for gauging market exposure.
-
Traffic: The in-site traffic metric reflects the actual number of customers entering the site and indicates the conversion rate of outside foot traffic to in-site visits. If analyzed on a monthly basis, it shows the rate of change between last month’s and this month’s data, offering further insight into the site's attractiveness.
-
Transaction: The transaction count metric shows the number of customers who completed a purchase, indicating how many in-site visitors were converted into actual sales. This directly affects site performance. If analyzed on a monthly basis, it displays the rate of change between last month’s and this month’s data.
-
Sales: The revenue metric tracks the site’s sales income, serving as a key indicator of site performance. It is directly linked to in-site visitors and transaction count, reflecting overall sales efficiency. If analyzed on a monthly basis, it shows the rate of change between last month’s and this month’s data.
> Note: To display data on outside foot traffic, a dedicated camera is required to specifically capture this metric. This camera cannot be shared with the one used for counting in-site visitors.
D.【Turn in Rate / Conversion Rate / Average Transaction Value】 ⇒ These three metrics are interrelated: turn in rate indicates the ability to attract customers, conversion rate reflects the efficiency in turning in-site visitors into purchases, and average transaction value represents the spending level of each customer. Together, they directly impact site performance and sales growth.
-
Turn in Rate: Calculated as "number of in-site visitors / outside foot traffic," the turn in rate measures the percentage of outside visitors who actually enter the site, indicating the site's appeal relative to external foot traffic. If analyzed on a monthly basis, it shows the change from last month's data to this month's data.
-
Conversion Rate: Calculated as "number of transactions / number of in-site visitors," the conversion rate represents the percentage of in-site visitors who make a purchase. This metric reflects the effectiveness of in-site service, product appeal, and customer service; a higher conversion rate means more visitors are completing purchases. If analyzed on a monthly basis, it shows the change from last month's data to this month's data.
-
Average Transaction Value: Calculated as "revenue / number of transactions," the average transaction value represents the average amount spent per transaction, indicating customer purchasing power and spending level per shopping trip. Along with the conversion rate, it impacts the overall revenue outcome. If analyzed on a monthly basis, it shows the change from last month's data to this month's data.
E.【Target vs. Actual Trend Analysis】 ⇒ This chart combines bar and line graphs to provide a clear comparison between set targets and actual data across six key metrics: target traffic count, actual traffic count, target sales, actual sales, target transaction count, and actual transaction count. The bar graph displays the target and actual values for visitor count, while the line graph represents the target and actual values for sales and transaction count. This trend analysis chart helps users quickly understand each metric's actual performance relative to preset targets and adjust business strategies promptly to improve visitor rates and revenue outcomes. The line graph can toggle between “Sales” and “Transaction Count” displays.
> Note:
- To set KPIs, please go to the "Settings" section on the main service platform. In the "Site" settings page, use the "Target & Weighted KPI Scores Settings" section to define targets for "Visitor Count/Revenue."
Data Analysis
This section provides cross-analysis of multiple statistical metrics for a single site, covering eight key data indicators: “Outside Traffic,” “Turn in Rate,” “Traffic,” “Sales,” “Transaction,” “Conversion Rate,” “Average Transaction Value,” and “Average Basket Size.” Through charts, these indicators can be displayed and compared across different statistical periods, including daily, weekly, monthly, and yearly.
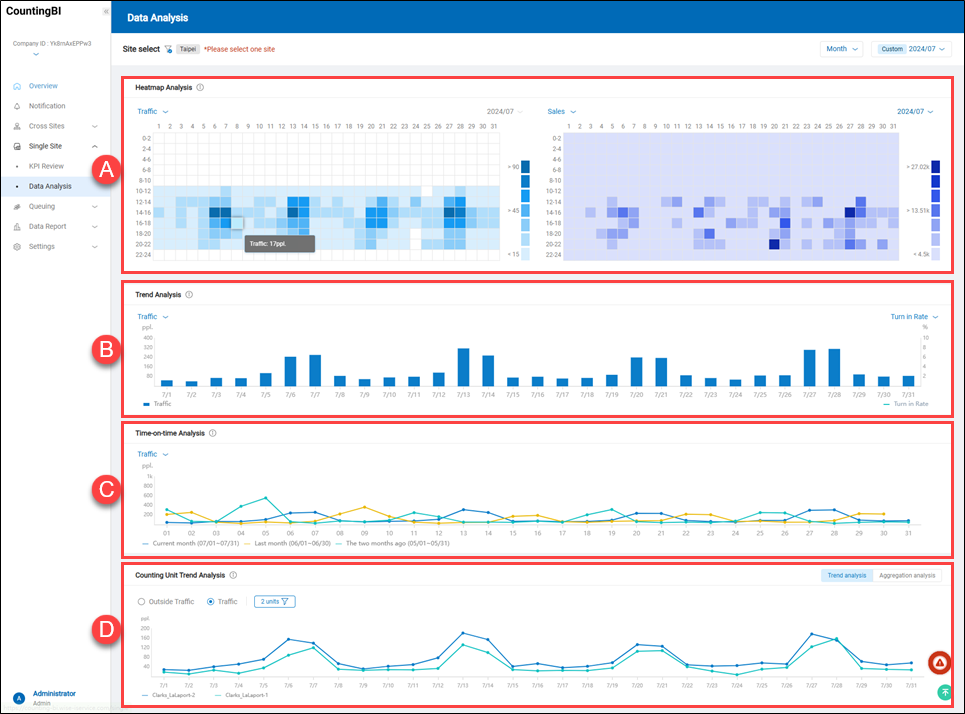 A.【Heatmap Analysis】 ⇒ The heatmap cross-analysis chart helps users delve into the interaction between two different metrics, such as the relationship between traffic and sales or variations in turn in rate and conversion rate, with gradient colors used to show fluctuations in data levels.
B.【Trend Analysis】 ⇒ The trend cross-analysis chart enables users to analyze the interaction between two different metrics in depth, for example, the relationship between traffic and sales or changes in turn in rate and conversion rate, using line and bar charts to display data variations.
C.【Time-on-Time Analysis】 ⇒ This analysis provides options to view statistics with week-over-week and year-over-year comparisons by selected metrics and periods, displaying periodic comparisons via line charts.
> Note:
- For a daily statistical period, the chart shows an hourly comparison for the past three days.
- For a weekly statistical period, the chart shows a daily comparison for the past three weeks.
- For a monthly statistical period, the chart shows a daily comparison for the past three months.
- For a yearly statistical period, the chart shows a monthly comparison for the past three years.
D.【Cross-Traffic Counting Unit Analysis】 ⇒ This analysis allows users to perform trend or cumulative analyses on foot traffic data across daily, weekly, monthly, and yearly periods. Using line charts, users can intuitively compare and track changes across different statistical units, helping identify foot traffic trends.
> Note:
- The term "counting unit" here refers to a foot traffic camera. Users can designate a single foot traffic camera as one "counting unit" based on entry and exit points or specific needs, or they can bind multiple foot traffic cameras together as one unit. In the latter case, the counting unit's foot traffic data will be the sum of these cameras' data.