Integrations
This feature provides Microsoft Power BI with a data integration management channel for the Crowd Data Analytics service, enabling Power BI to obtain various statistical data from the service. Through this feature, Power BI can access and present the following three types of statistical data in real time. Users can leverage Power BI’s diverse charting capabilities to further visualize and analyze statistical data, as well as generate reports.
- Sales Report: Analyzes sales trends based on POS data, providing insights for marketing decisions.
- Traffic Report: Tracks visitor numbers and behavior patterns to optimize space management.
- Queuing Report: Monitors queue status to enhance service efficiency and customer experience.
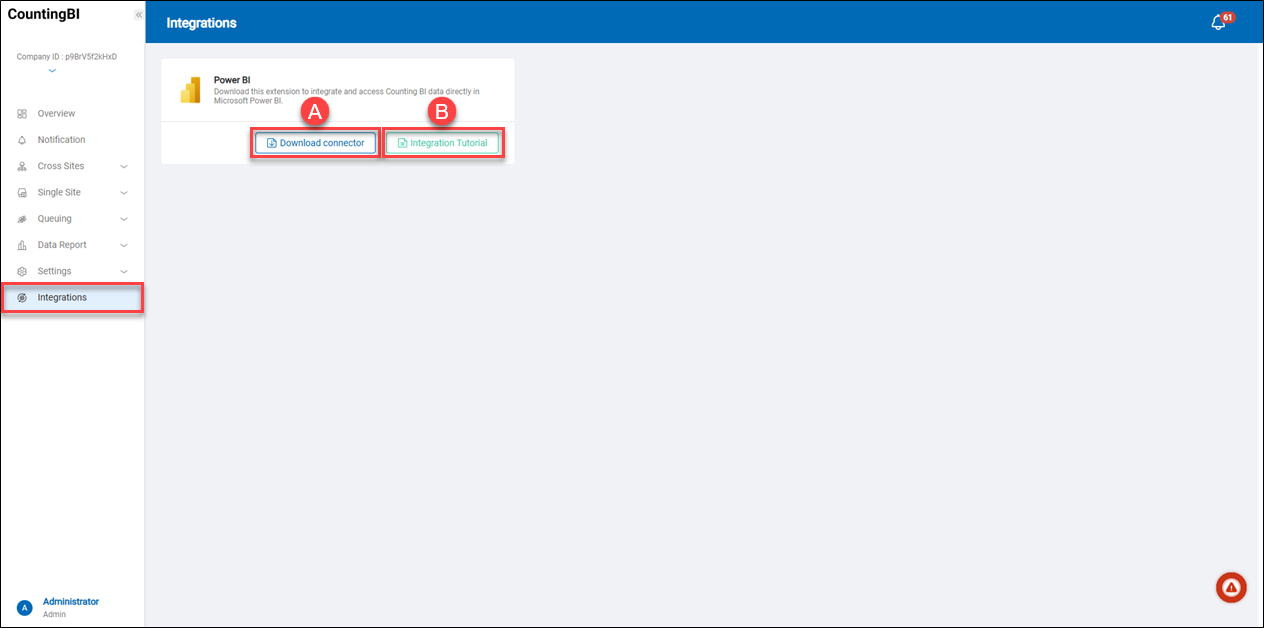 A.【Download Connector】 ⇒ Click the "Download Connector" button to download the connector extension file. This file is required when configuring data import in Power BI. The file should be named "counting-powerbi.mez".
B.【Integration Tutorial】 ⇒ Click the "Integration Tutorial" button to open a pop-up window with step-by-step instructions for integrating the "connector extension file" with Power BI.
A.【Download Connector】 ⇒ Click the "Download Connector" button to download the connector extension file. This file is required when configuring data import in Power BI. The file should be named "counting-powerbi.mez".
B.【Integration Tutorial】 ⇒ Click the "Integration Tutorial" button to open a pop-up window with step-by-step instructions for integrating the "connector extension file" with Power BI.
Example instructions for integrating Power BI
The following instructions explain how to use the connector extension file to display statistical data from the Counting BI service in Power BI charts.
Items You Will Need:
- Install the Microsoft Power BI application on the local computer.
- Have a valid user account for the Counting BI service on the WISE-iService cloud platform.
- Use the Access key for the Counting BI service.
- Obtain the Site ID of the site (store) on the WISE-iService cloud platform.
- Integrate the Power BI connector extension file.
Step 1: Download the connector extension file and move the file to the specified folder.
Before performing this step, it is assumed that you have already downloaded and installed the Microsoft Power BI Windows application and have a valid user account for the Counting BI service.
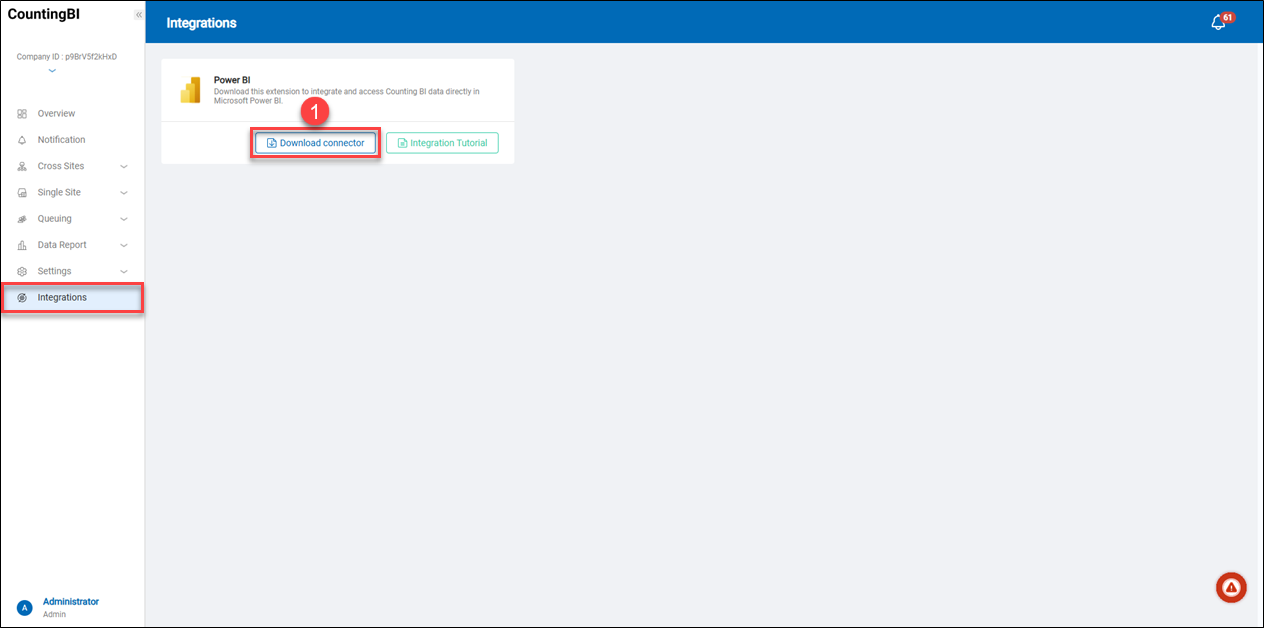 1. Go to the "Integrations" page in the left-side menu, click the "Download Connector" button, and download the connector extension file. The file should be named "Advantech_CountingBI_connector.mez".
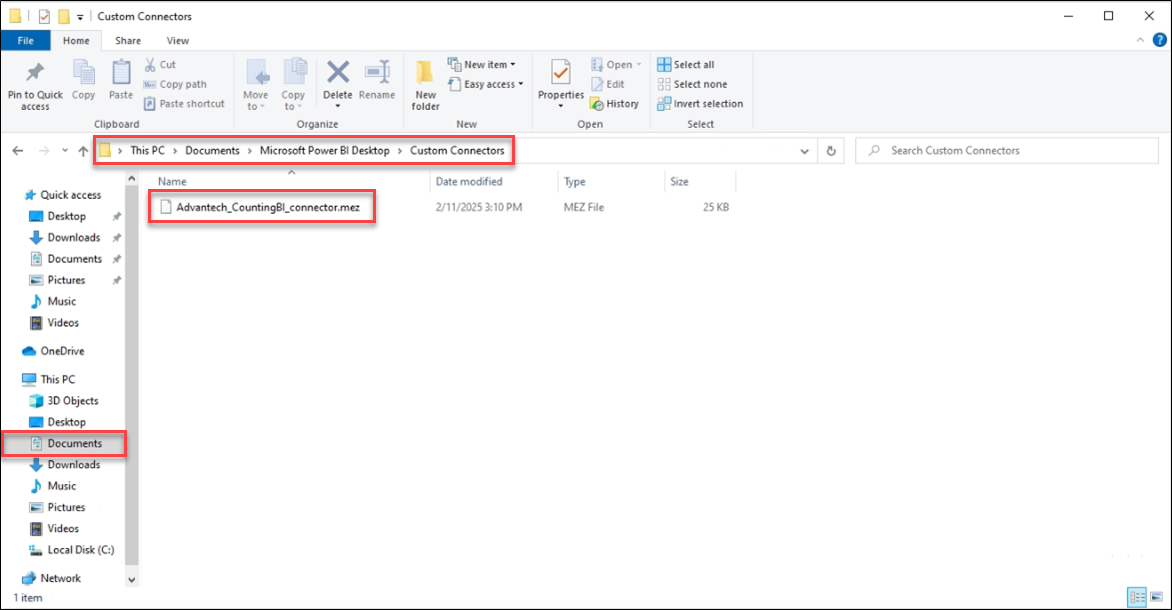
2. On the Windows computer where Power BI is installed, create a two-level folder structure under the "Documents" directory: Microsoft Power BI Desktop\Custom Connectors. Then, move the connector extension file (Advantech_CountingBI_connector.mez) into this folder, as shown in the example below.
1. Go to the "Integrations" page in the left-side menu, click the "Download Connector" button, and download the connector extension file. The file should be named "Advantech_CountingBI_connector.mez".
2. On the Windows computer where Power BI is installed, create a two-level folder structure under the "Documents" directory: Microsoft Power BI Desktop\Custom Connectors. Then, move the connector extension file (Advantech_CountingBI_connector.mez) into this folder, as shown in the example below.
Reference folder path: C:\Users\user\Documents\Microsoft Power BI Desktop\Custom Connectors
Step 2: Add the "AccessKey" on the WISE-iService Cloud Platform
Log in to the WISE-iService Cloud Platform using a web browser.
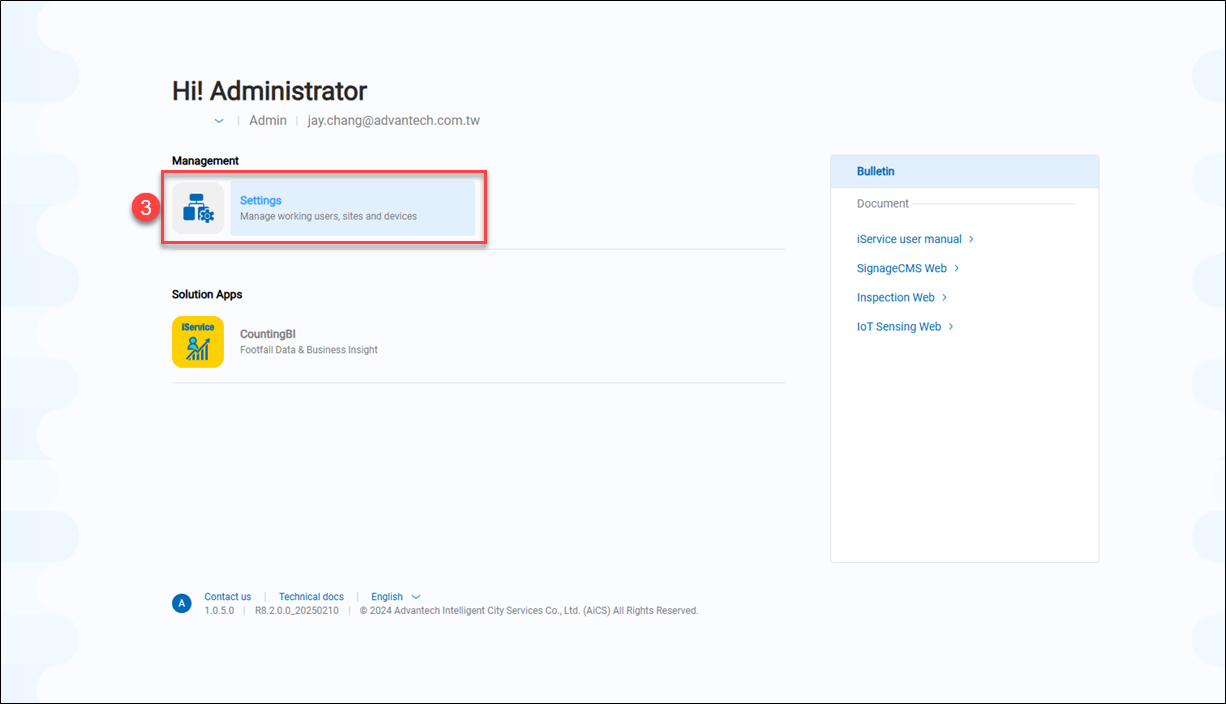 3. After logging in to the WISE-iService Cloud Platform, click on the "Settings" page.
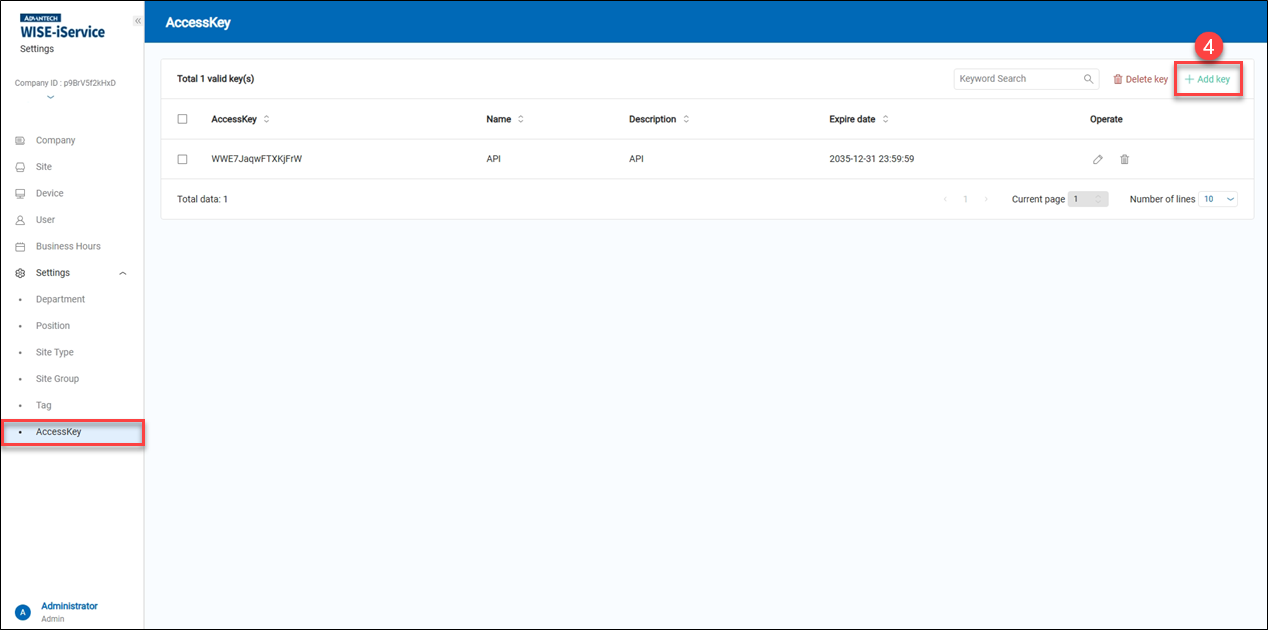 4. Click "+ Add key"。
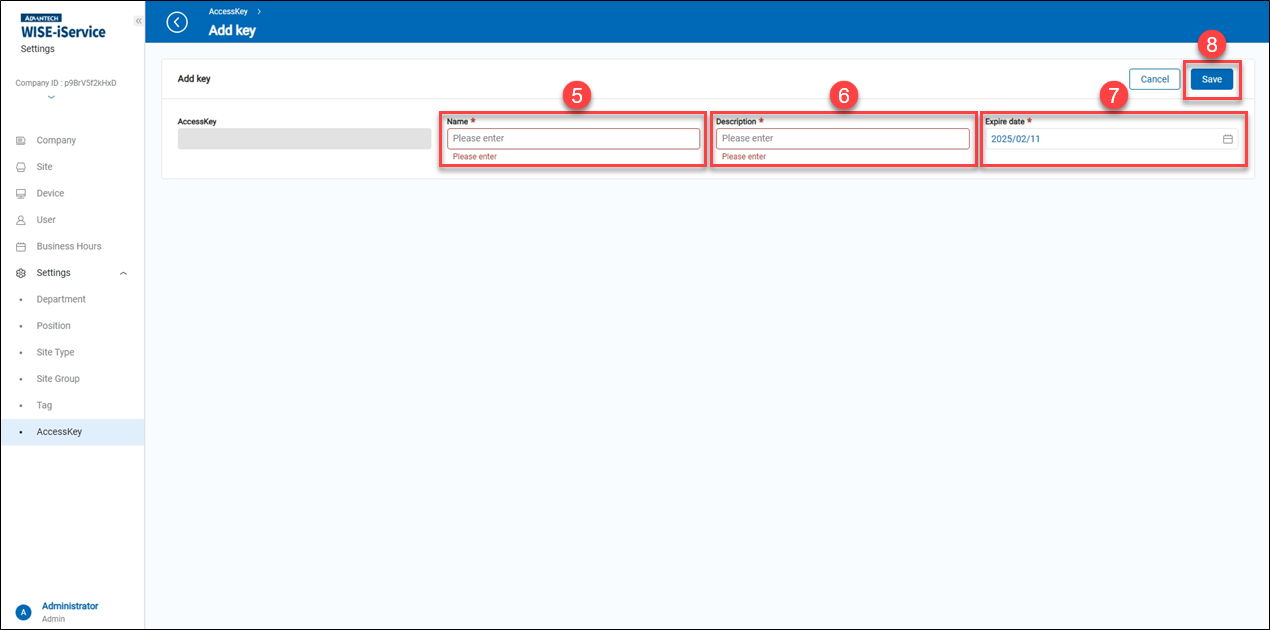 5. Name: Enter a name for the AccessKey purpose.
6. Description: Enter a description that helps users identify the purpose of this AccessKey.
7. Expire date: Please select an expiration date for the AccessKey. Note: The key will become invalid once the selected date is reached.
8. Click "Save" to apply the settings.
5. Name: Enter a name for the AccessKey purpose.
6. Description: Enter a description that helps users identify the purpose of this AccessKey.
7. Expire date: Please select an expiration date for the AccessKey. Note: The key will become invalid once the selected date is reached.
8. Click "Save" to apply the settings.
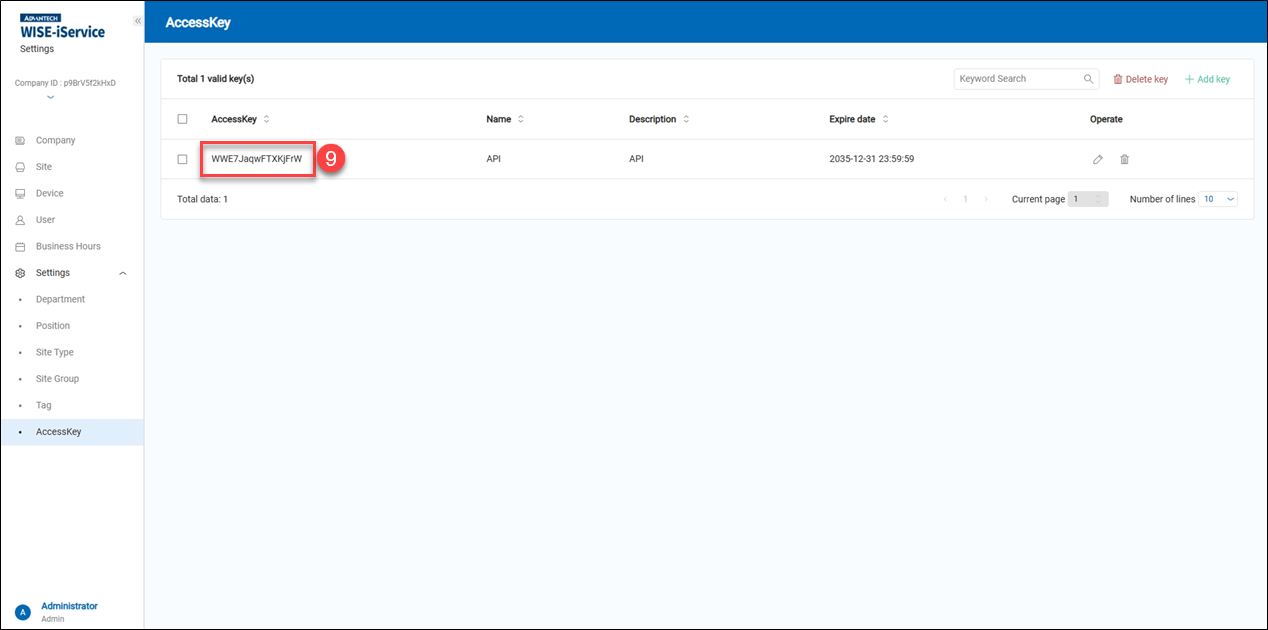 9. After adding the AccessKey, copy the key generated randomly by the system. It will be used later when configuring the Power BI integration.
Step 3: Obtain the "Site ID" Information from the WISE-iService Cloud Platform
This site (store) houses the footfall statistics, queue statistics, and POS data. Power BI will retrieve the statistical data from this site (store).
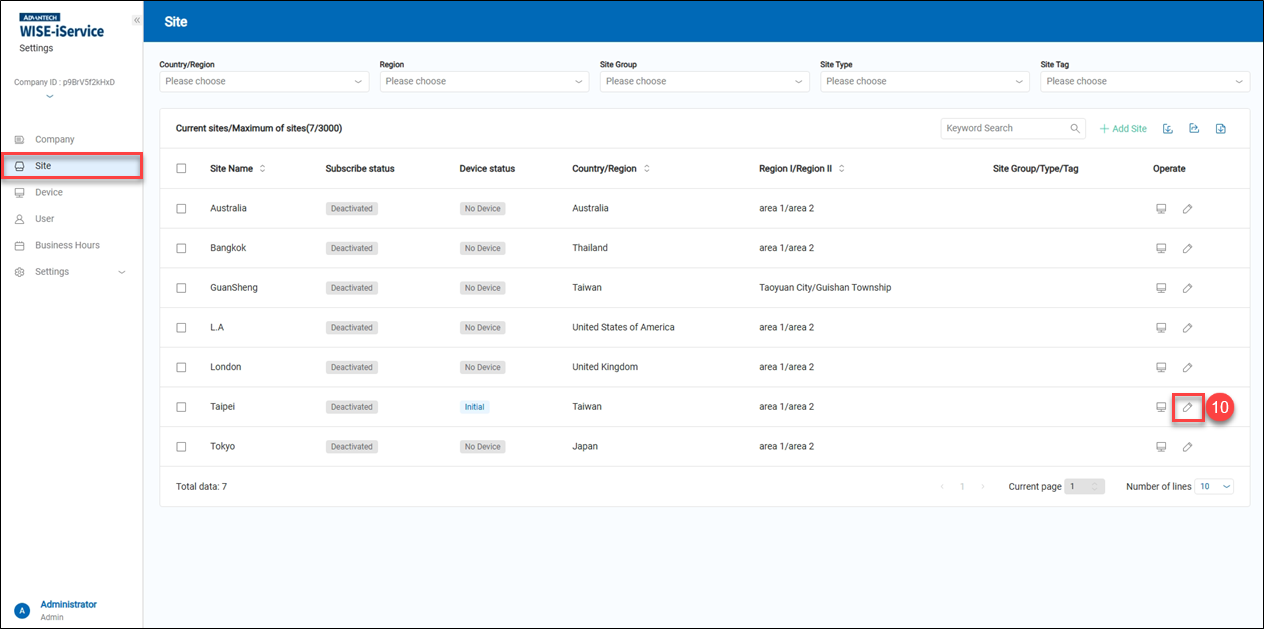 10. Go to the "Site" page in the left-side menu, and click the "Edit" icon on the right side of the site (store) you wish to integrate with Power BI.
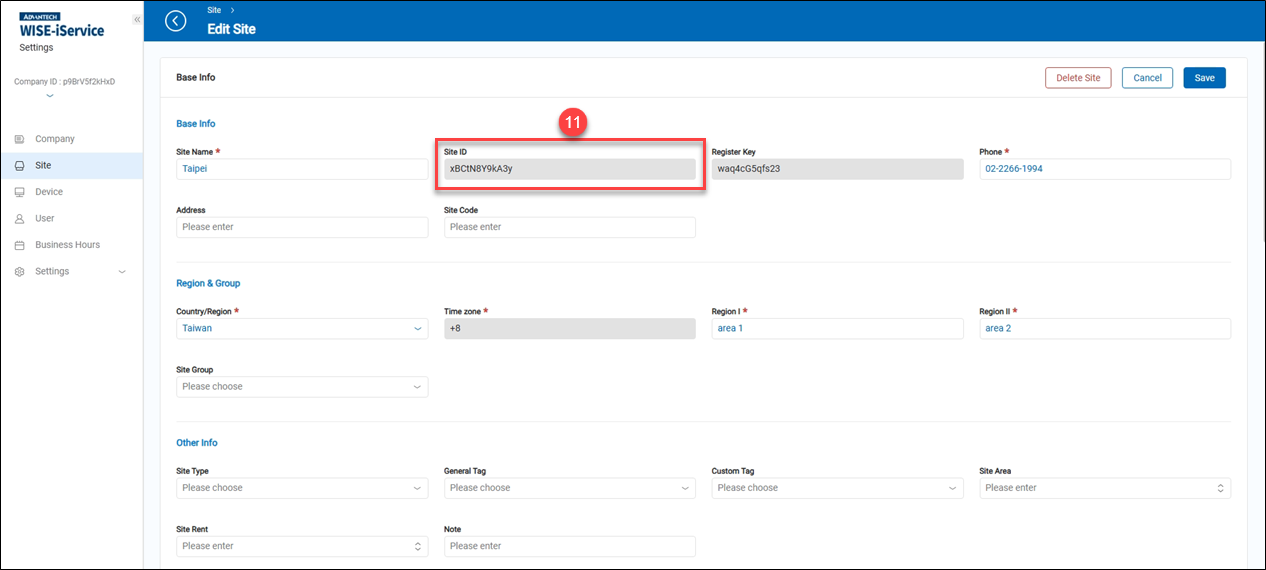 11. Copy the "Site ID" information. It will be used later when configuring the Power BI integration.
Step 4: Configure Power BI
First, open the Power BI application and adjust the data extension security settings.
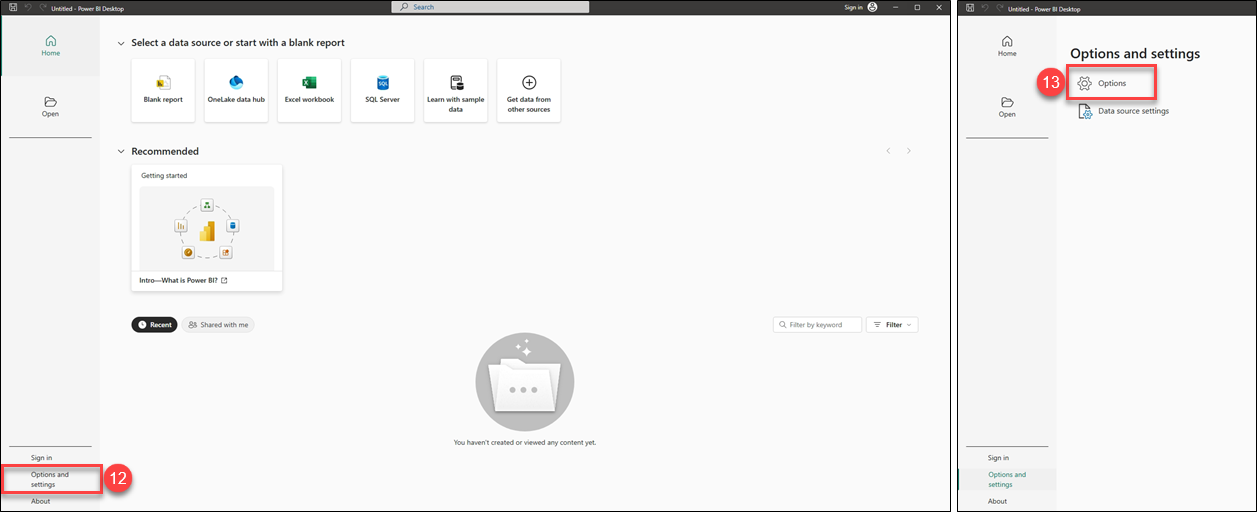 12. Click on "Options and settings".
13. Click on "Options".
12. Click on "Options and settings".
13. Click on "Options".
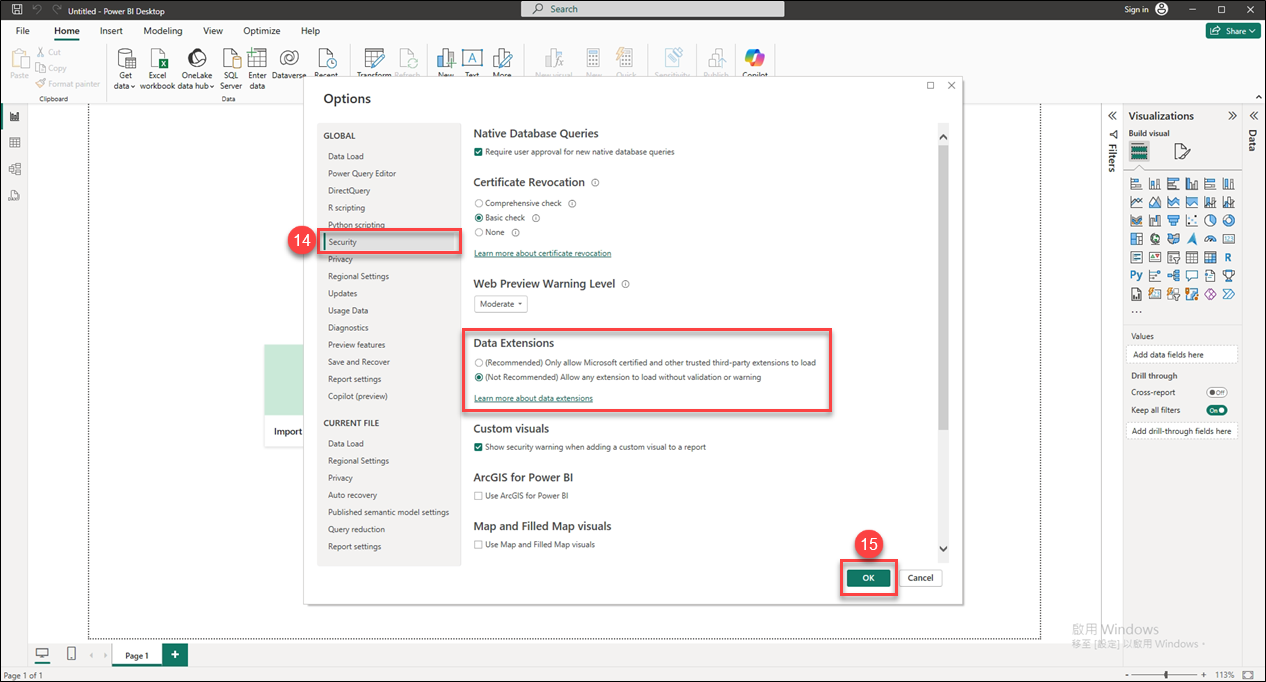 14. Click on "Security", and under the "Data Extensions" section, select "(Not Recommended) Allow any extension to load without validation or warning."
15. Click "OK" to apply the settings, and then restart the Power BI application.
14. Click on "Security", and under the "Data Extensions" section, select "(Not Recommended) Allow any extension to load without validation or warning."
15. Click "OK" to apply the settings, and then restart the Power BI application.
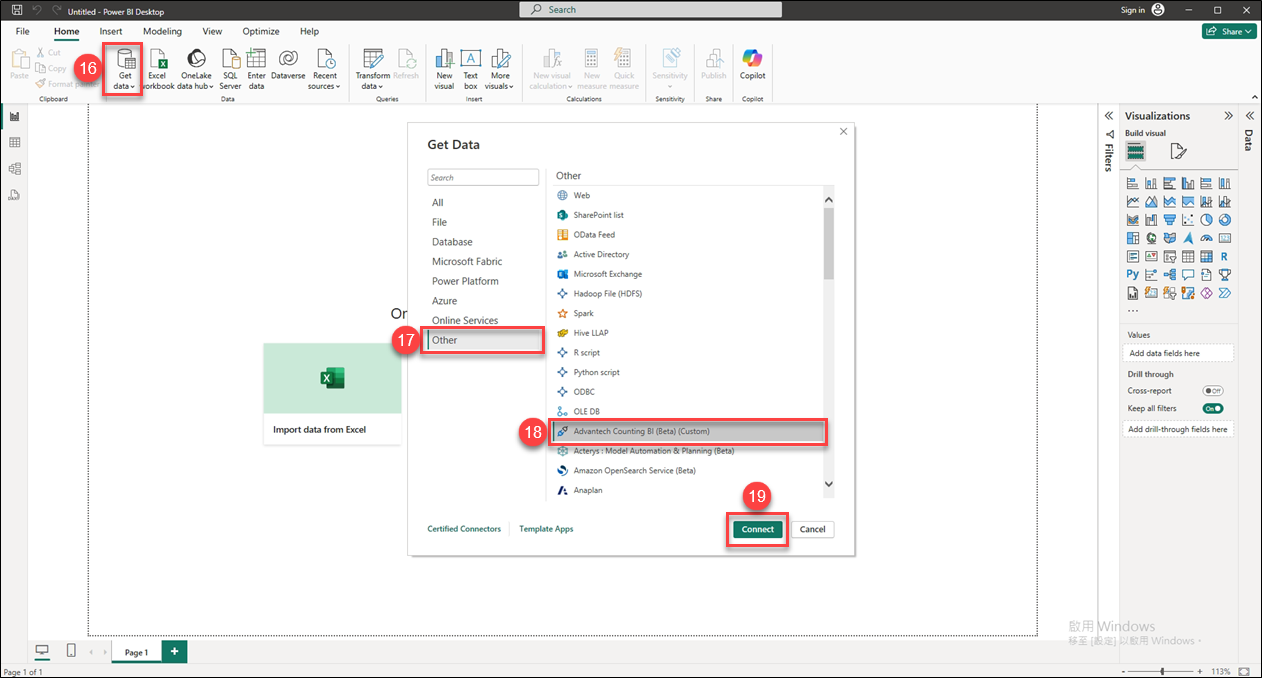 16. Click on the "Get Data" option.
17. Click on the "Other" option.
18. Select the "Advantech Counting BI (Beta) (Custom)" option.
19. Click on "Connect".
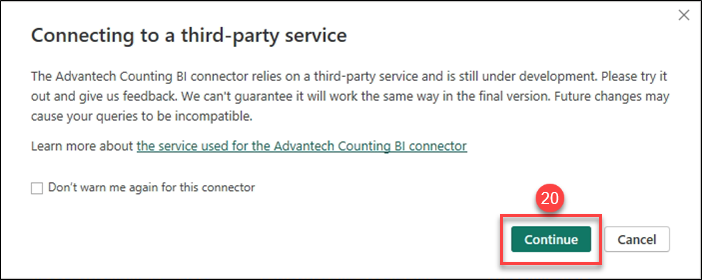 20. Click on "Continue".
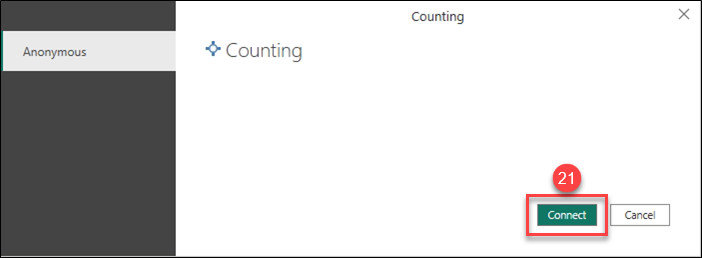 21. Click on "Connect".
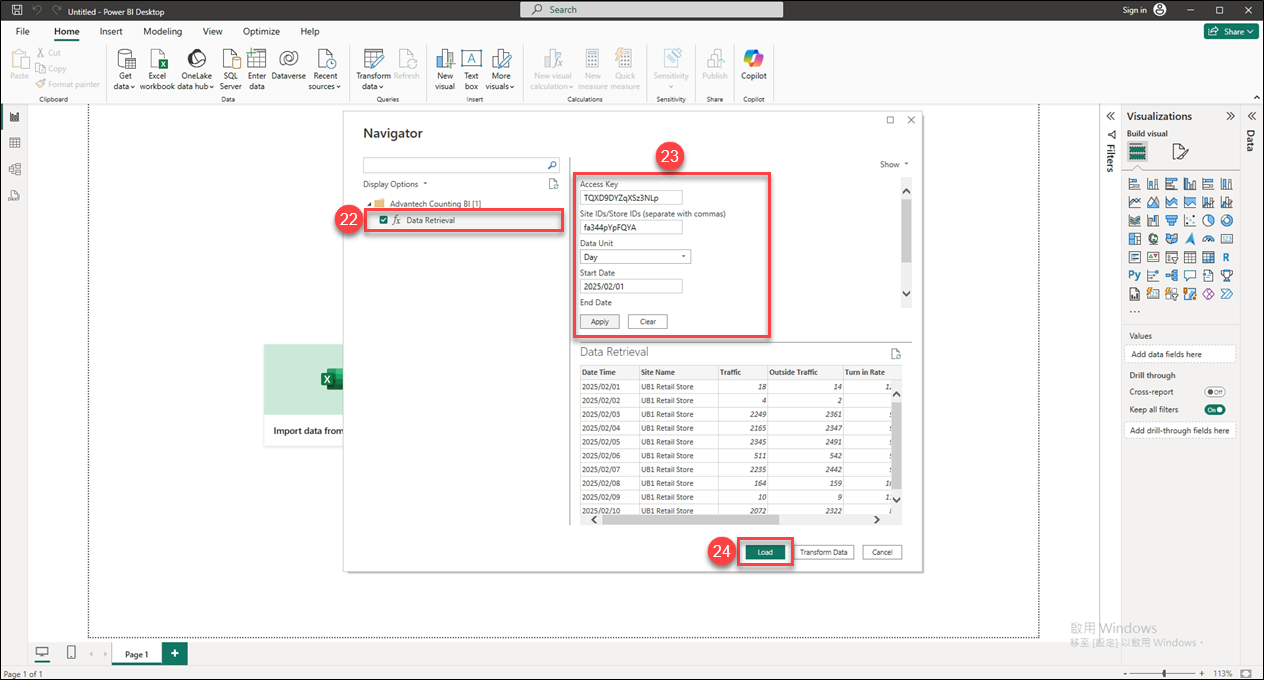 22. Check the fx Data Retrieval box.
23. Fill in the following relevant information to allow Power BI to retrieve statistical data for the site/store. After entering the information, click the "Apply" button.
a. Access Key: Enter the key required to retrieve the statistical data.
b. Site IDs/Store IDs: Enter the ID of the site/store from which the statistical data will be retrieved.
c. Data Unit: Choose the data period unit. Two options are available: "Hour" and "Day".
d. Start Date: Select the start date for retrieving statistical data.
e. End Date: Select the end date for retrieving statistical data.
f. Data Type: Three types of statistical data are available: "Sales Report", "Traffic Report", and "Queue Report". In this example, select "Traffic Report".
24. Click on "Load", and after the data has finished loading, the screen will return to the Power BI desktop.
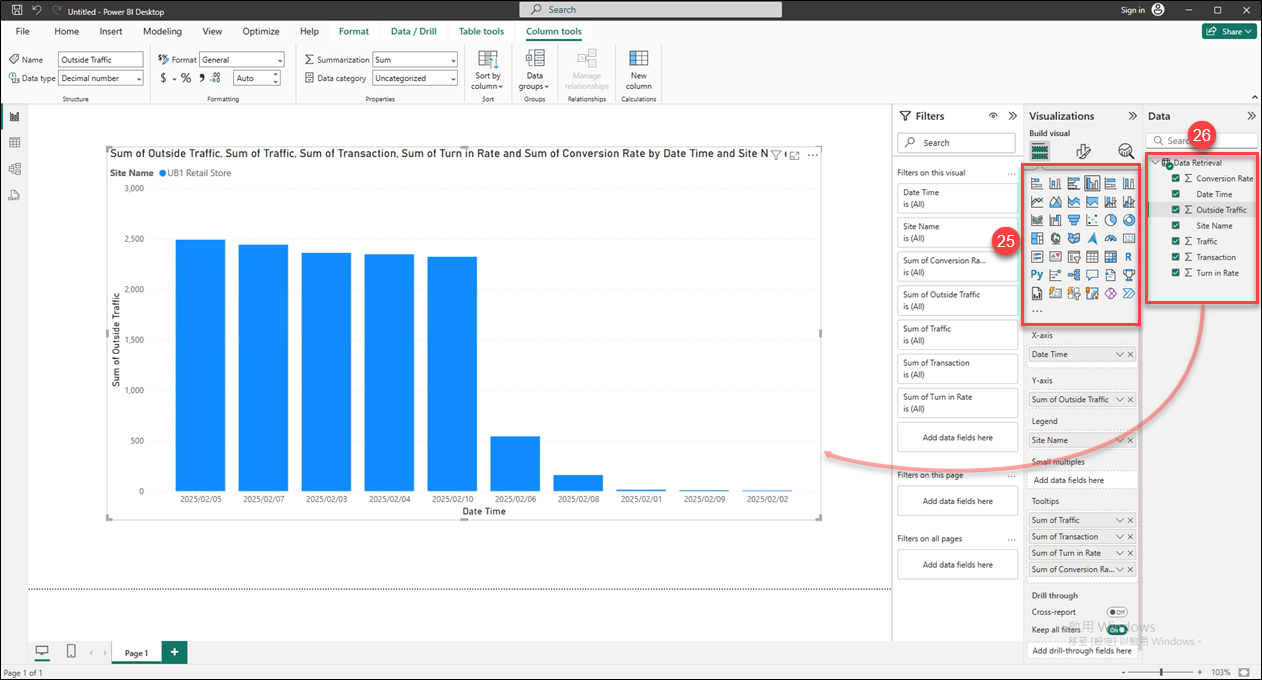 25. First, select the chart type for displaying the statistical data in the Visualizations section. In this example, "Clustered Column Chart" is selected.
26. Expand the Data Retrieval section, and then check the statistical items to be displayed on the chart.