2.3 Energy Efficiency Management
The energy efficiency management submodule comprises four core functions: Efficiency Overview, Efficiency Calendar, Efficiency Comparison, and Equipment Efficiency Analysis.
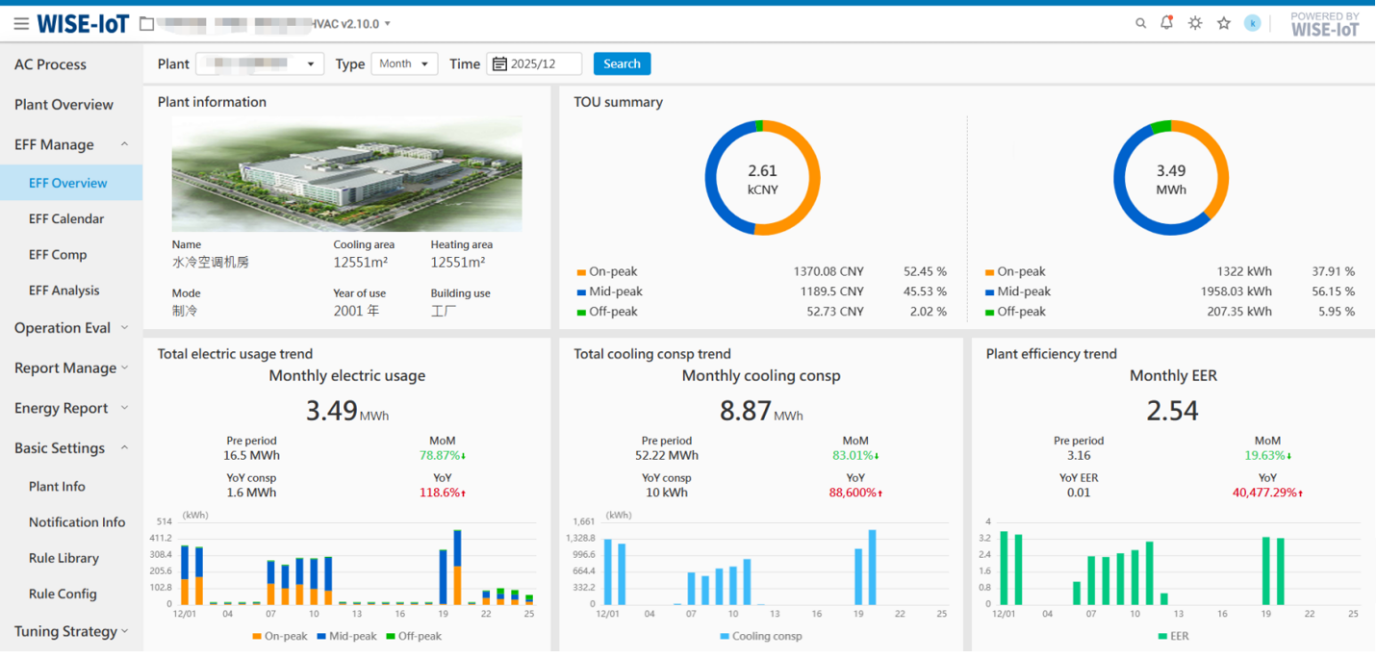
2.3.1 Efficiency Overview
Displays the energy station's basic information and supports time-based statistics (daily/weekly/monthly/annual) for total power consumption trends, total cooling capacity trends and System COP (Coefficient of Performance) trends.
Key Notes:
-
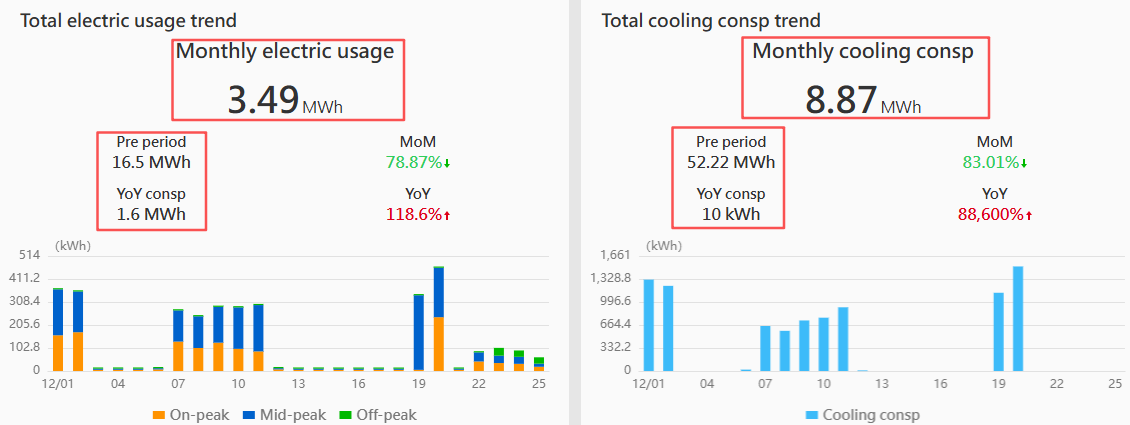
Rounding Rules: For values displayed in the red-framed panel area when the unit is kWh (base unit), the system will display rounded integers only, while converted units may display up to two decimal places.
-
Decimal Display: All data on this page shows a maximum of two decimal places. Trailing zeros are omitted.
-
Time Range Queries: Supports filtering by day/week/month/year.
-
Efficiency Calculation:
COP = Periodic Cooling/Heating Output ÷ Periodic Energy Consumption
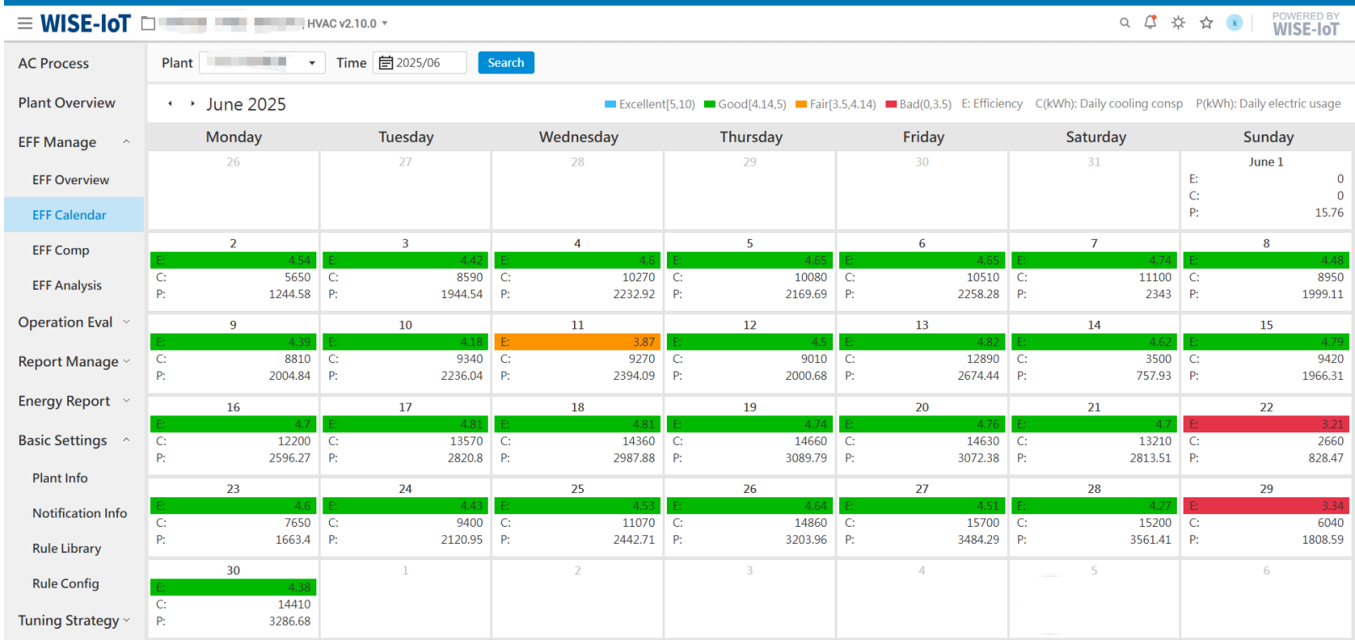
2.3.2 Efficiency Calendar
Displays the system's daily energy efficiency data in a monthly calendar format, including:
- E: Operational efficiency
- C (kWh): Daily cooling/heating production
- P (kWh): Daily Energy consumption and the evaluation range of efficiency indicators
Key Notes:
-
Decimal Display: All data on this page shows a maximum of two decimal places. Trailing zeros are omitted.
-
E Comparison: The calendar's E values are compared against the threshold in the upper-left corner. E values within the threshold range (Excellent/Good/Fair/Poor) are highlighted with corresponding background colors, while out-of-range values remain uncolored.
-
Tooltip for Fair/Poor E: Hovering over Fair or Poor E values triggers a pop-up box displaying the daily efficiency values of associated factors.
Efficiency Factors by Energy Station Type:
- Water-Cooled Stations: Chillers, Cooling Pumps, Chilled Water Pumps
- GSHP Stations: GSHP Units, Ground Source Side Pumps, HVAC Side Pumps
- Efficiency Thresholds: Derived from the energy efficiency thresholds configured in the [Cooling energy efficiency indicators] module under [Plant Info].
2.3.3 Energy Efficiency Comparison
This feature supports comparing data for a single metric or multiple metrics across different time periods within a single project (a single asset group), as well as ranking multiple projects (multiple asset groups) based on the same metric.
Note: The indicators displayed on this page are selected from the [Indicator Manage] menu. Please ensure that indicators are configured first.
The functionality is explained separately for single asset groups and multiple asset groups below.
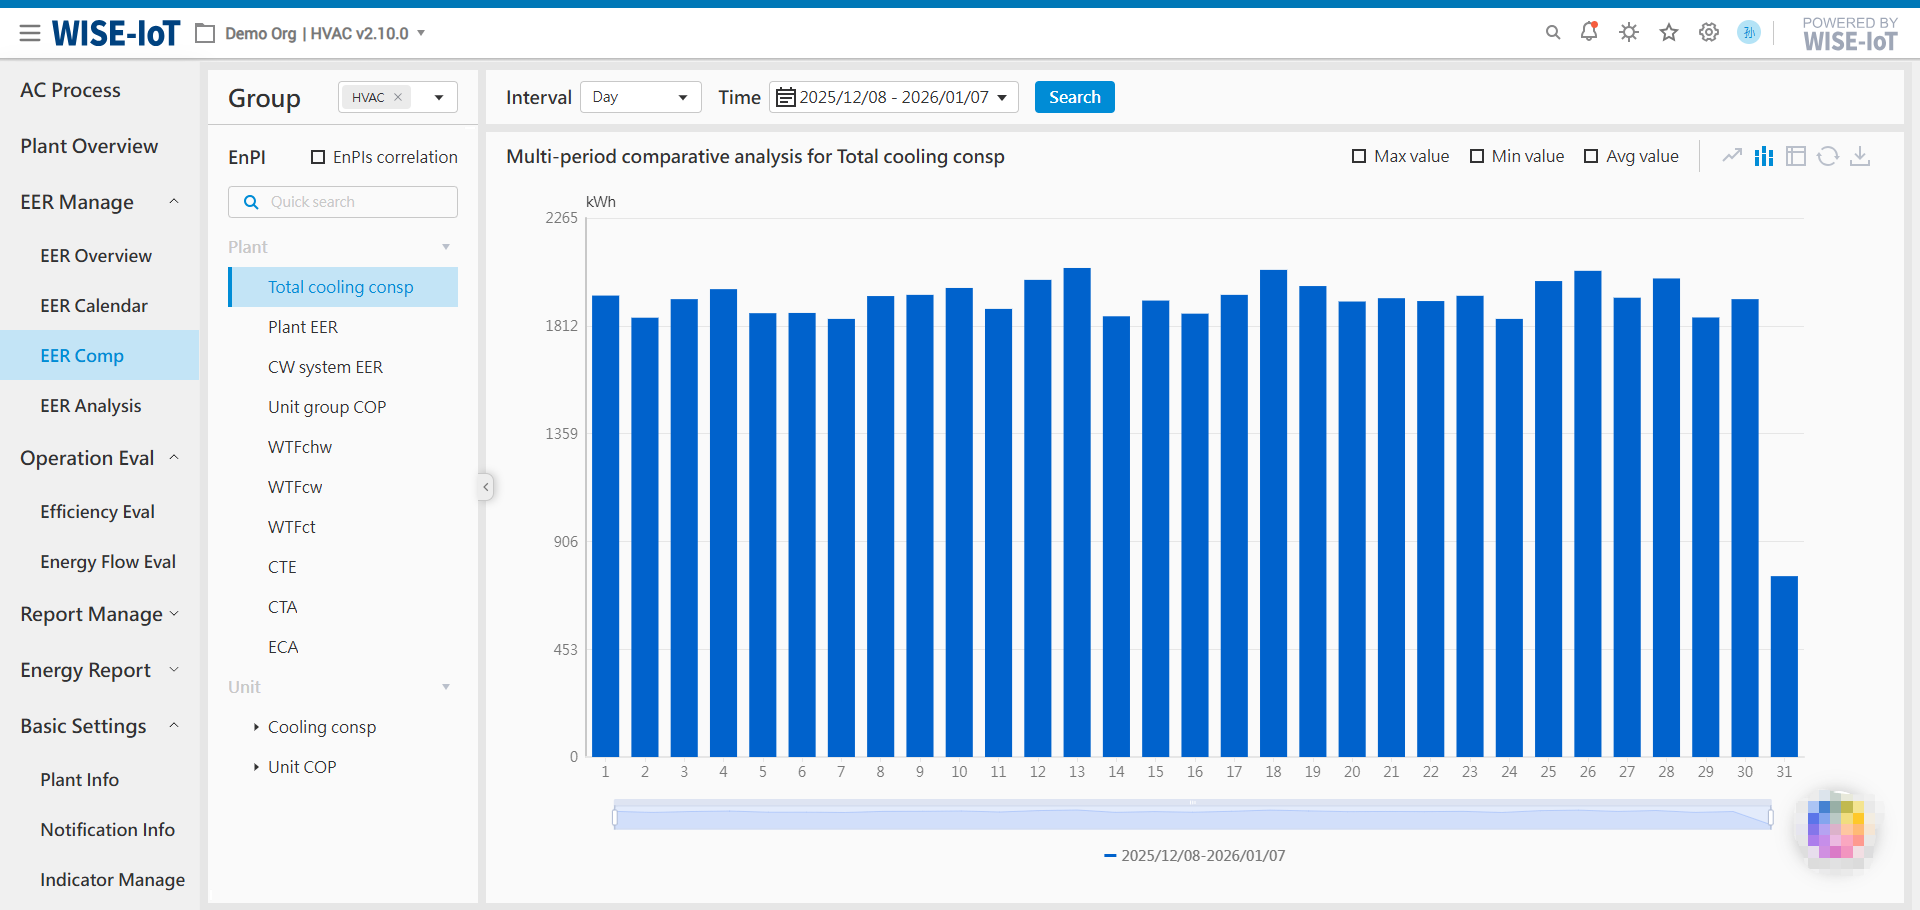
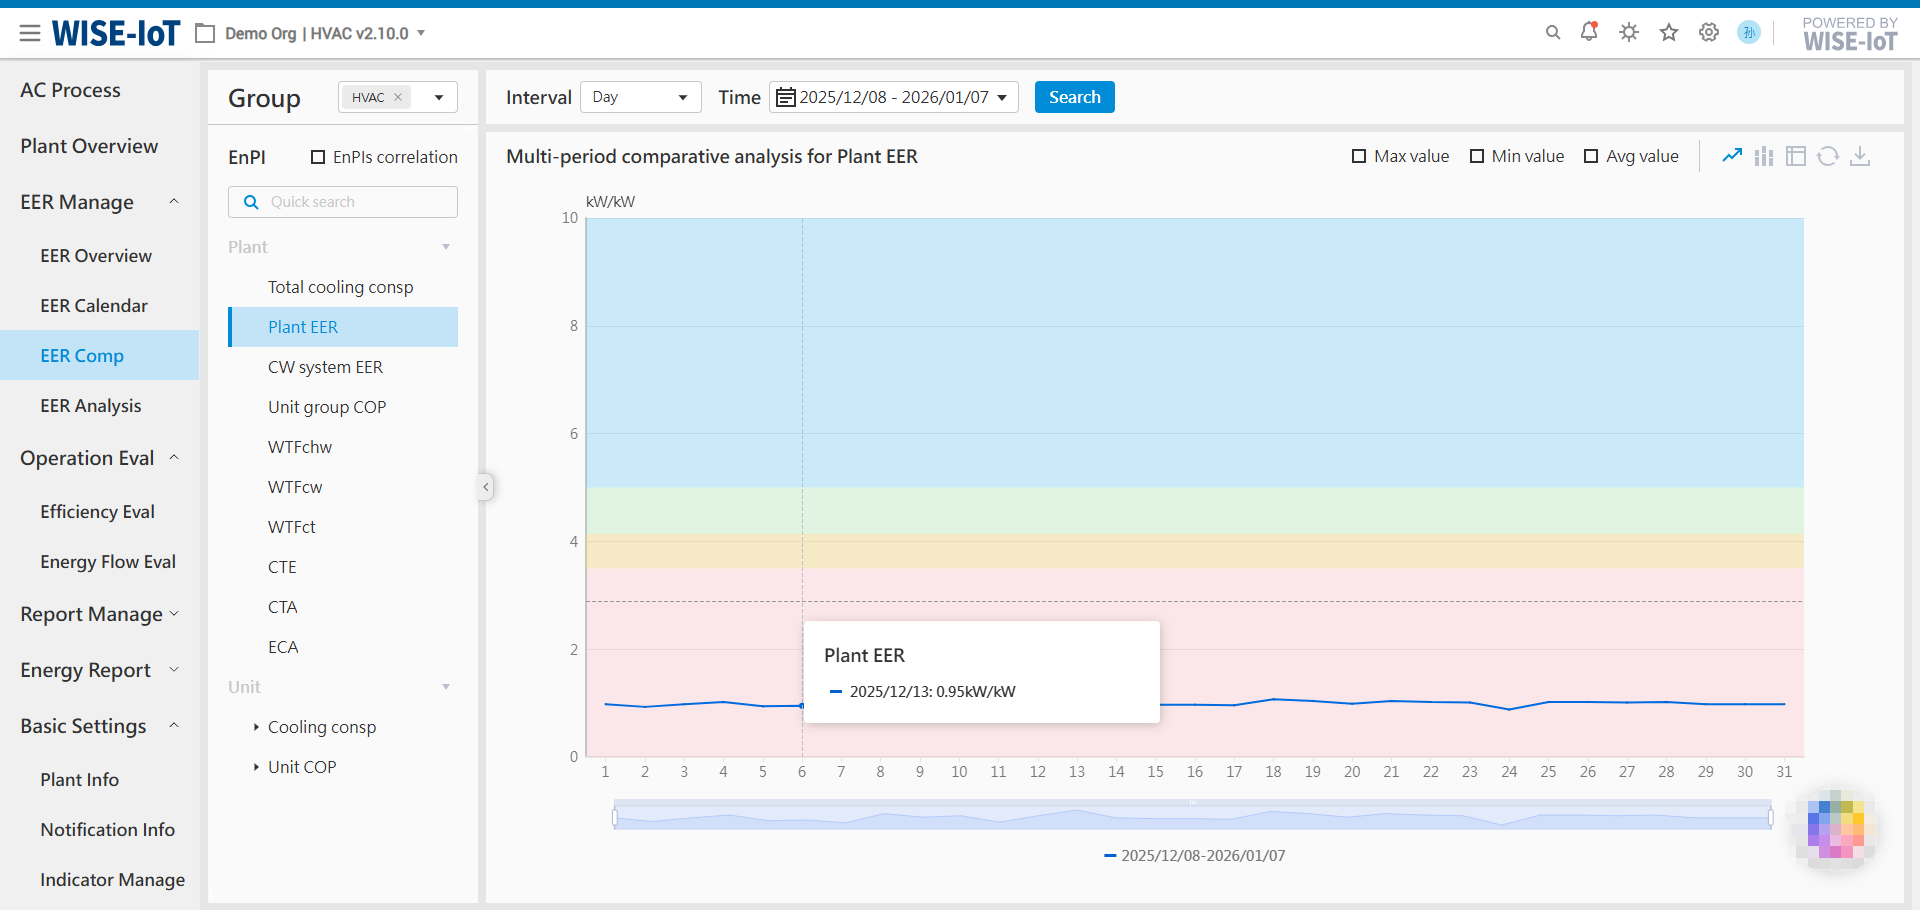
2.3.3.1 Single Asset Group Energy Efficiency Metric Comparison
Query data for a single metric or multiple metrics across different time periods.
Single Metric Query
Supports querying individual metrics across time periods.
Single Indicator Multi-Time Query
Checking the "EnPIs correlation" option supports querying indicator data for multiple objects simultaneously.
Key Notes:
-
Query Intervals: The query intervals and their corresponding time ranges are linked as follows:
- Month – One data entry per month, default query shows the most recent 12 months' data, with a maximum query range of 3 years.
- Day – Default option, one data entry per day, default query shows the most recent month's data, with a maximum query range of 24 months.
- Hour – One data entry per hour, default query shows the most recent 7 days' data, with a maximum query range of 31 days.
- Minute – One data entry every 15 minutes, default query shows the current day's data, with a maximum query range of 31 days.
-
Data Presentation Formats: Supports different data presentation formats: line chart, bar chart, and table. Query results can be exported to Excel.
-
Auxiliary Data: When displaying in line or bar charts, auxiliary data can be added:
- Maximum/Minimum Values: Displayed with marker bubbles.
- Average Value: Displayed with a dashed line, and the average value is labeled on the line.
-
Indicator Scope Explanation: For a single project (a single asset group) containing multiple energy stations, users can query overall metrics at the energy station level, metrics for each individual chiller unit (host level), or aggregated metric data across all energy stations.
For scenarios with multiple energy stations, certain metrics do not support aggregated data queries and are limited to single-object metric data retrieval. Metrics that do not support aggregation will be displayed in a disabled state and will be inactive/not respond when clicked.
Important Note: For Unit Group COP and Air Conditioning Pump Transport Coefficient, if all multiple energy stations are of the same type (e.g., all water-cooled or all ground-source heat pump systems), these two metrics support aggregated calculation. Otherwise, if the energy stations include different types, these two metrics do not support aggregated calculation.
-
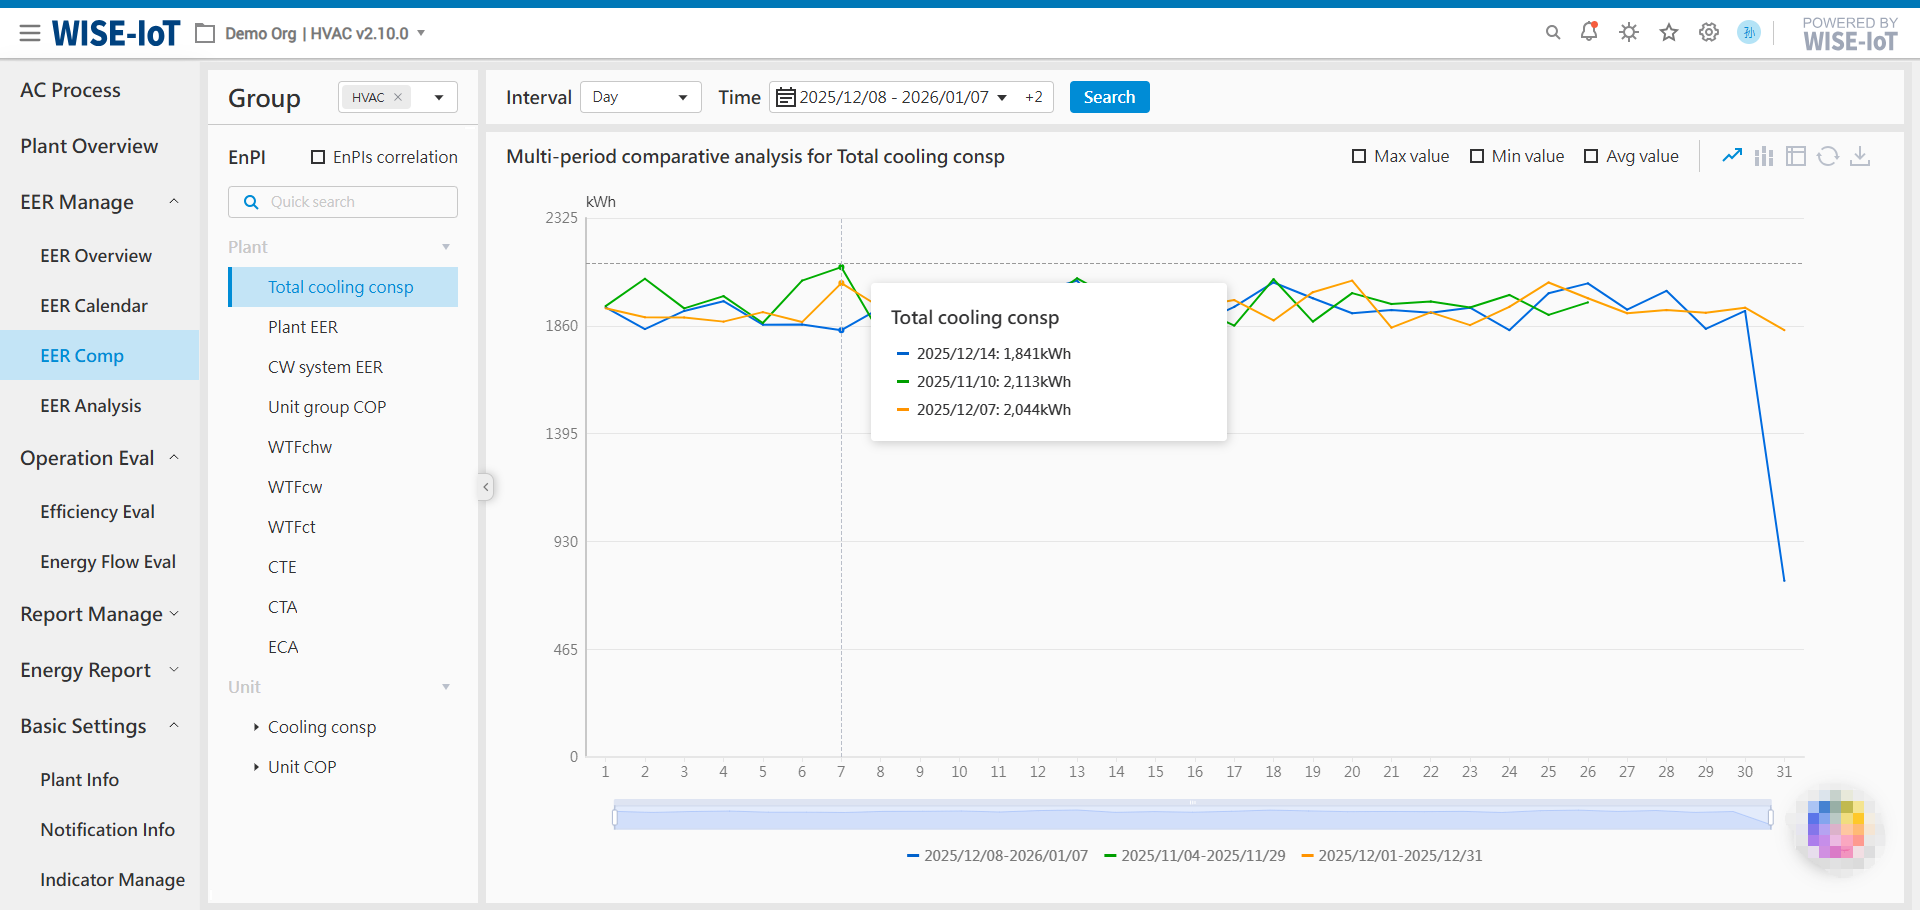
Multi-Time Query: Multi-Time Query for a Single Indicator (with "EnPIs correlation" unchecked) allows for longitudinal comparison by selecting multiple time periods.
![]()
![]()

-
Threshold Functionality: This version inherits the threshold functionality from the previous energy efficiency comparison feature. A background threshold will be displayed for the following single metric queries.
Note: For indicators with thresholds, if the aggregated metric is selected, the threshold for the aggregated metric will follow the threshold configured for the first energy station.
Plant Type Indicators Threshold Configuration Location Water-Cooled system Plant EER, CW system EER, Unit group COP, WTFchw, WTFcw Energy efficiency thresholds configured in the Energy Efficiency Metrics module under Plant Information. Ground Source Heat Pump system Plant EER, GSHP system EER, Unit group COP, WTFacp, WTFgsp Energy efficiency thresholds configured in the Energy Efficiency Metrics module under Plant Information. Air Source Heat Pump system Plant EER, Unit group COP, WTFacp Energy efficiency thresholds configured in the Energy Efficiency Metrics module under Plant Information. -
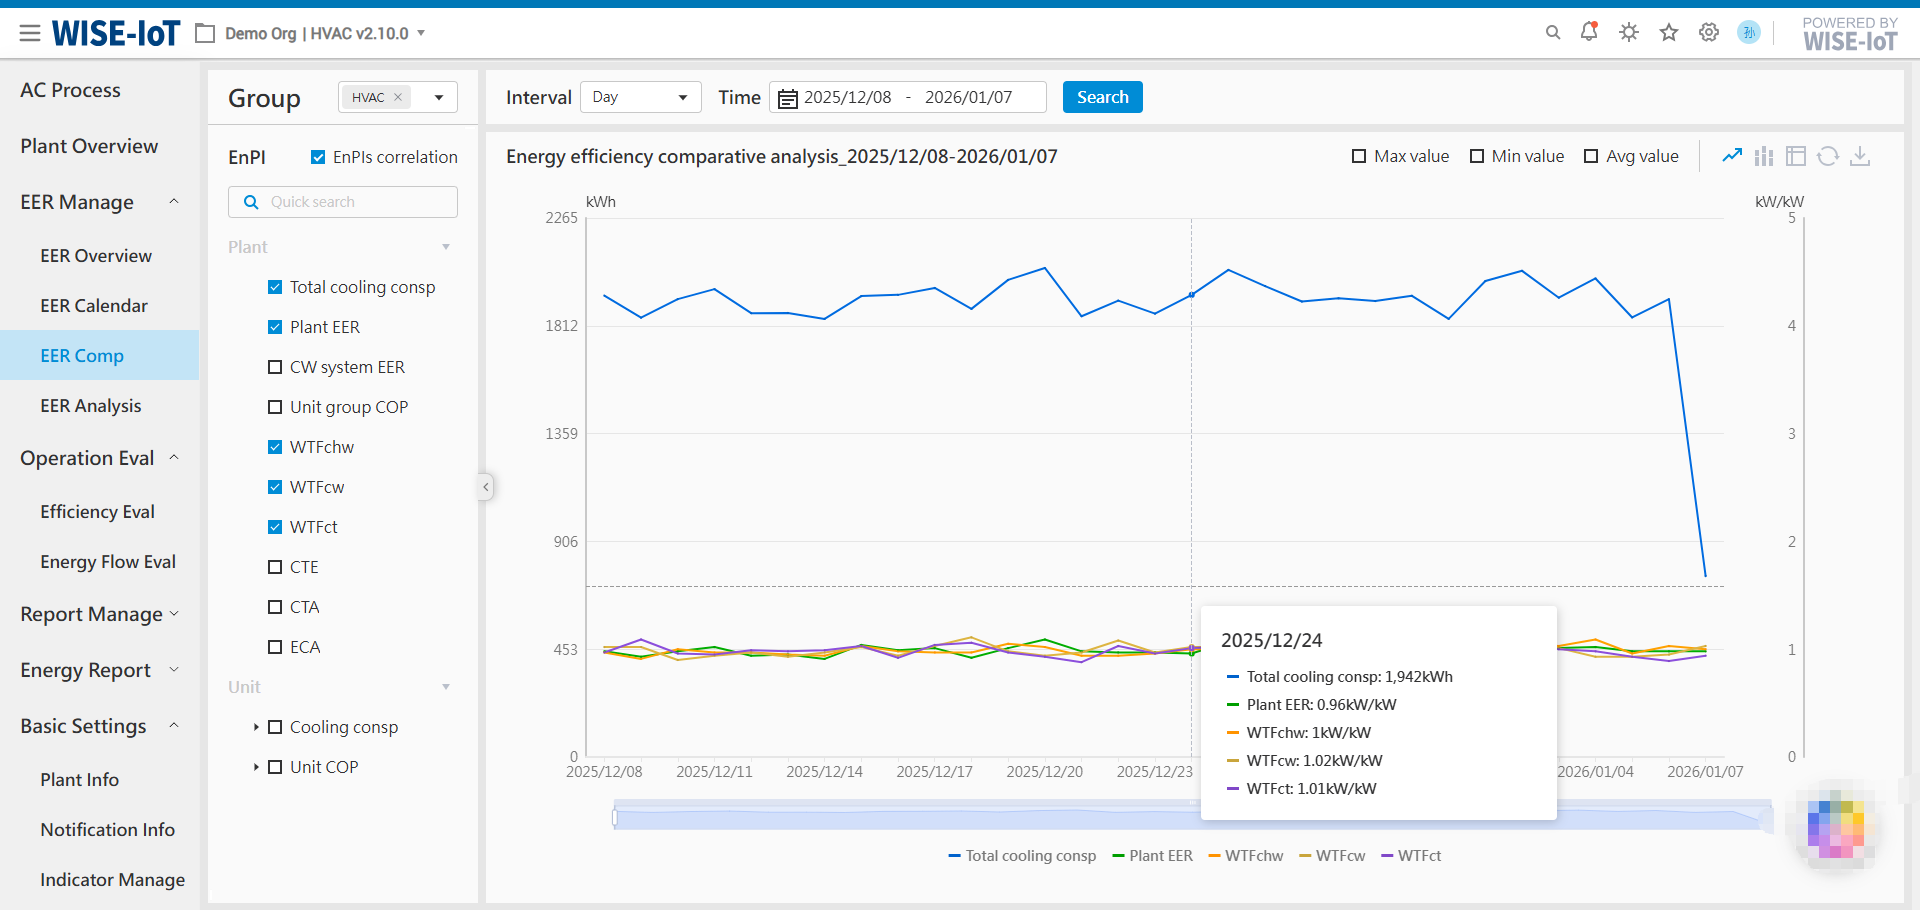
Multi-Metric Correlation Analysis: When performing multi-metric correlation analysis, multiple metrics can share a common Y-axis. The categories for sharing a Y-axis are as follows:
Note: This applies regardless of whether the metric is for the entire asset group or a single object.
Indicator Category Shared Y-axis Default Unit Consumption Category (Total) Heating production, (Total) Cooling production, Total heat dissipation, Total heat absorption kWh Efficiency Ratio Category (Cooling/Heating production ÷ Energy consumption) Plant EER, CW system EER, GSHP system EER, Unit group COP, WTFchw, WTFcw, WTFct, Unit COP, WTFacp, WTFgsp kW/kW Cooling Tower Approach CTA ℃ Deviation Rate, Efficiency CTE(Cooling Tower Efficiency), Chilled-Condenser diff ratio(Chilled/Cooling Water Deviation Rate), AC-GS diff ratio(Air Conditioning Side/Ground Source Side Deviation Rate) % Specific Consumption ECA(Energy Consumption per Unit Area), CCA(Cooling Consumption per Unit Area), HCA(Heating Consumption per Unit Area) kWh/㎡

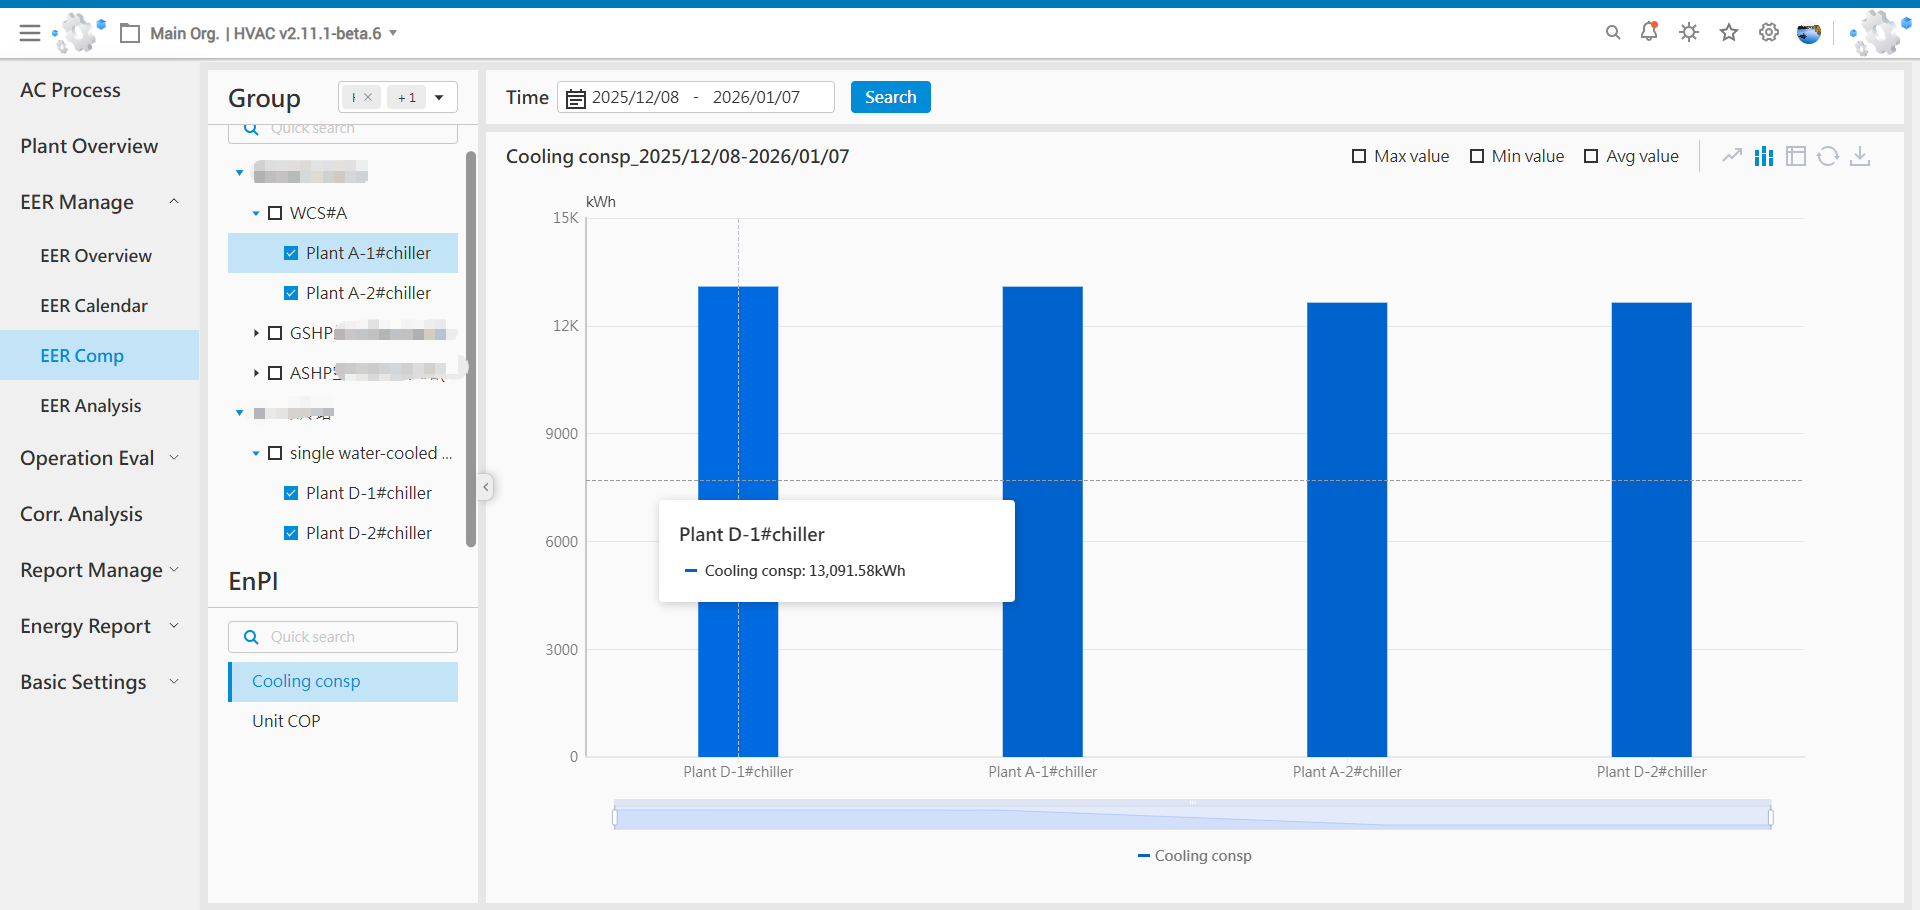
2.3.3.2 Multi-Asset Group Energy Efficiency Metric Comparison
The primary purpose of multi-asset group comparison is to evaluate the relative performance of multiple objects against the same indicator.
Key Notes:
-
Time Range Selection: The time range is selected on a daily basis. A query can cover a specific period of up to one year, supporting cross-year queries.
-
Left Panel Selection Area Description:
- Asset Group Selection (Multiple): Selected asset groups are displayed in two distinct areas (upper and lower), showing their key nodes (i.e., objects) and metrics.
- Asset Group Tree: The asset group tree only displays essential nodes: the asset group root node, energy station nodes, and host (chiller/unit) nodes.
- Indicator Area: This area only displays metrics that are common to all selected objects in the asset group tree. The criterion for being "common" is having identical metric names.
-
Auxiliary Data (Max/Min): The maximum and minimum values refer to the nodes with the numerically highest and lowest values among the selected nodes. If multiple nodes share the same extreme metric value, a marker bubble will be displayed on each of those nodes.
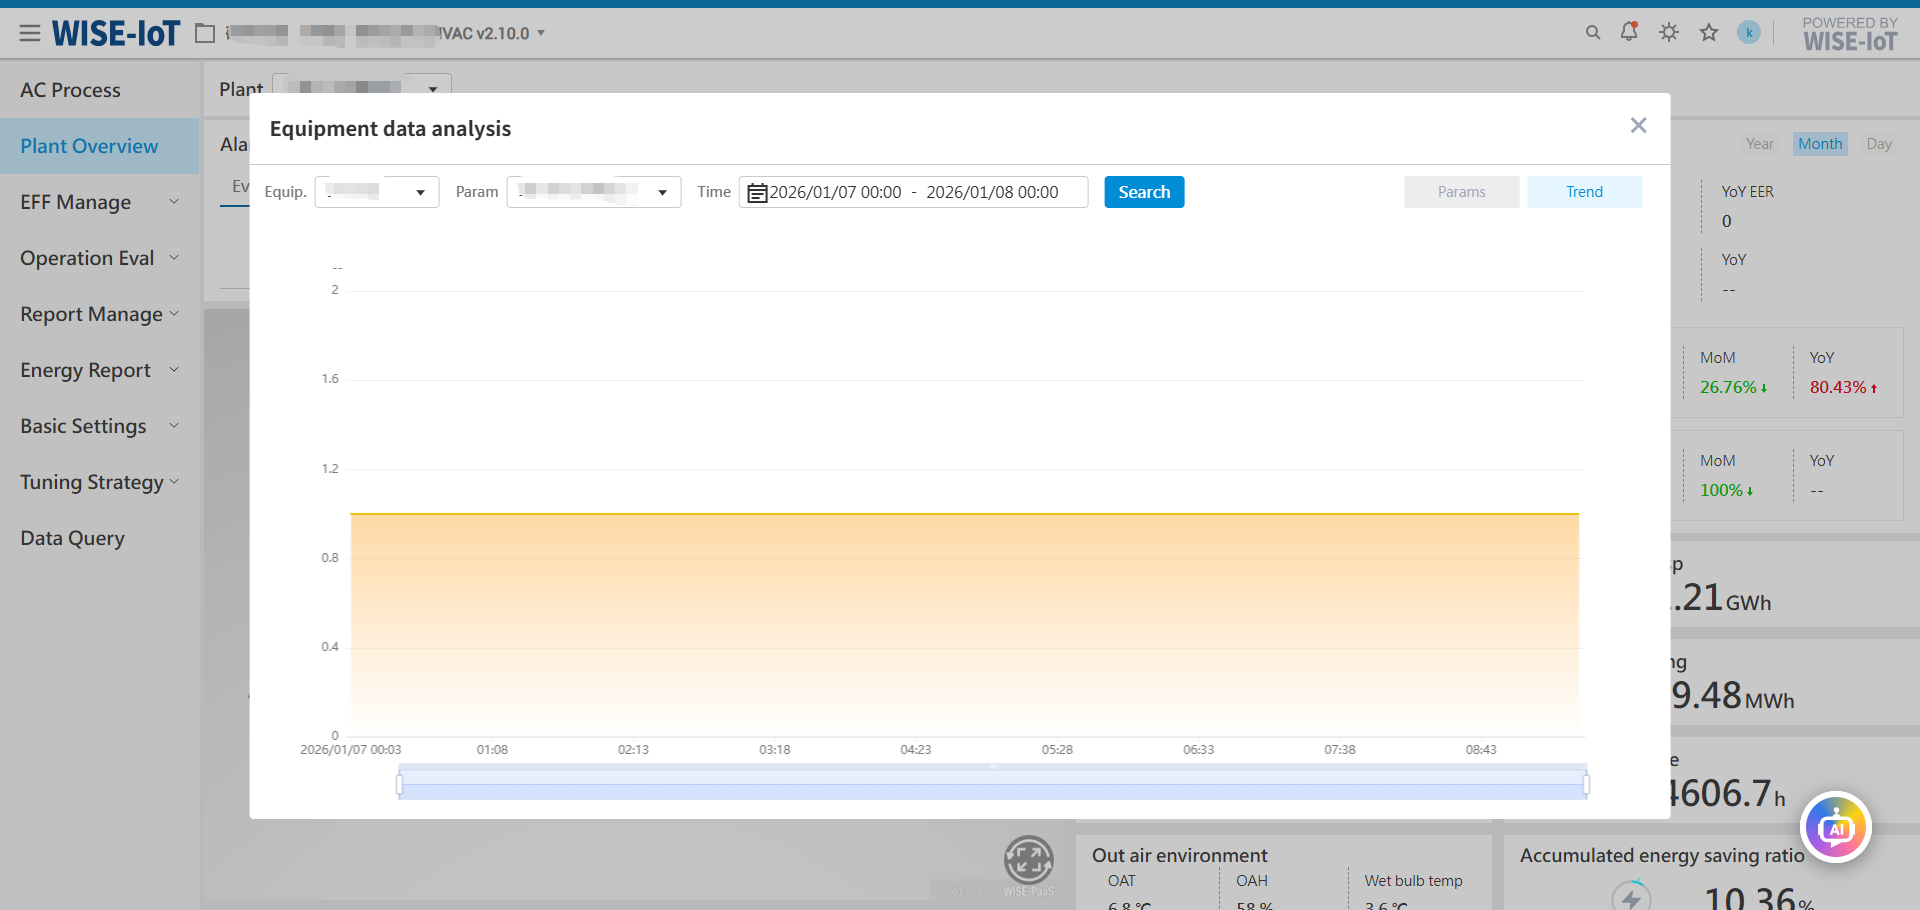
2.3.4 Equipment Energy Efficiency Analysis
This page analyzes energy efficiency impact factors from an equipment perspective to help users identify causes of low efficiency in different types of equipment and implement improvements.
Currently supports analysis of heating/cooling source equipment (e.g., chillers, ground-source heat pump units), pumps (chilled water pumps, cooling water pumps, ground source side circulation pumps, air-conditioning side circulation pumps), and cooling tower equipment types.
The number of metrics varies by equipment type, and the graphical display area automatically adapts based on the number of selected metrics.
Supported Data Granularity:
- Yearly – One data entry per year, default query shows the most recent 5 years' data, with a maximum query range of 5 years.
- Monthly – One data entry per month, default query shows the most recent 12 months' data, with a maximum query range of 3 years.
- Daily - One data entry per day, default query shows the most recent month's data, with a maximum query range of 24 months.
- Hourly - One data entry per hour, default query shows the most recent 7 days' data, with a maximum query range of 31 days.
- Minute - One data entry per minute, default query shows the most recent 24 hours' data (precise to minute), with a maximum query range of 24 hours.
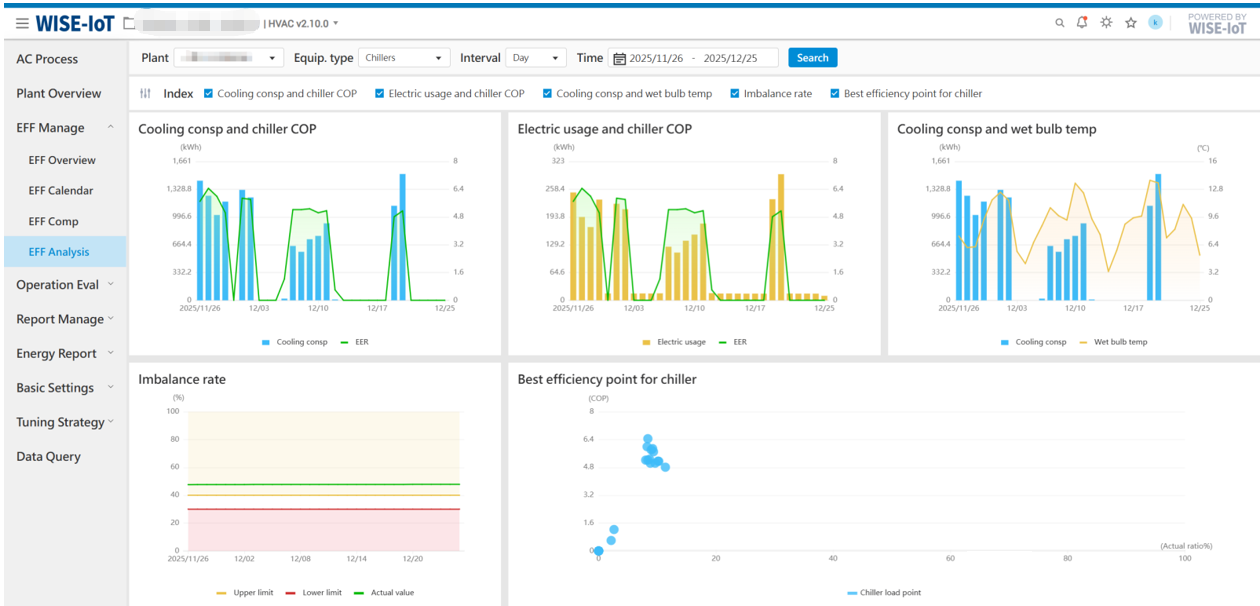
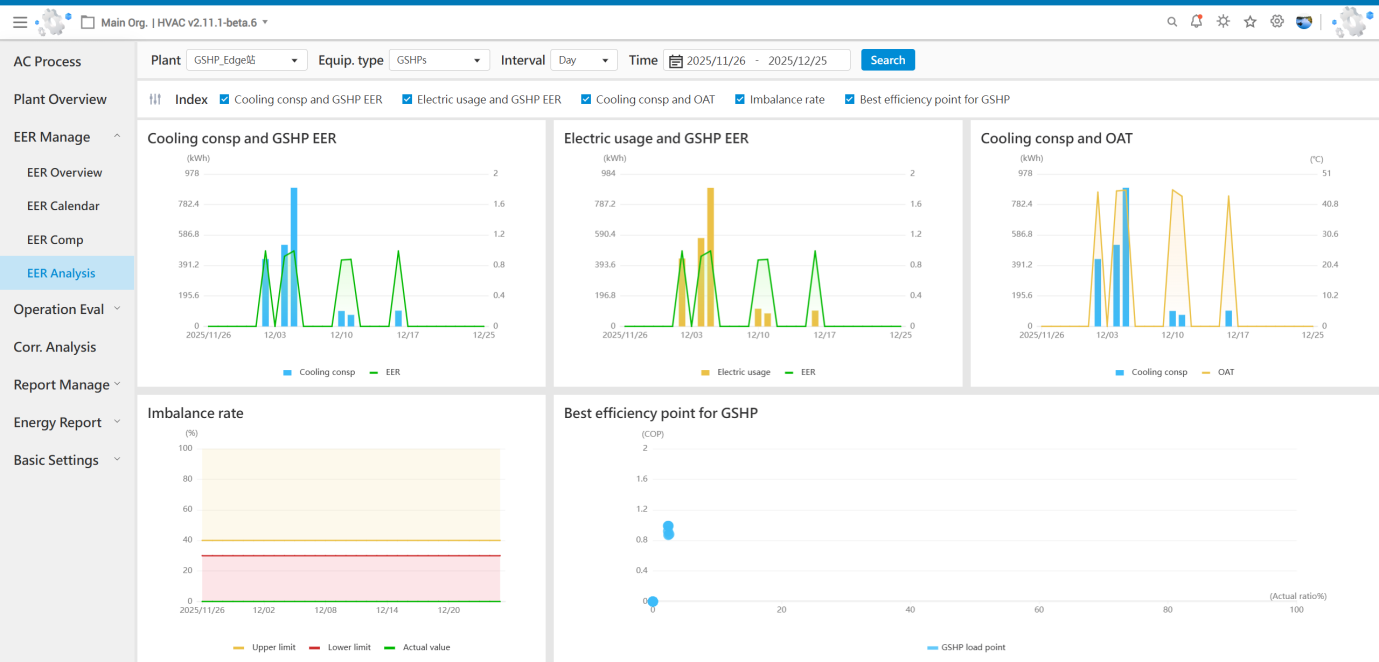
2.3.4.1 Heating/Cooling Source Equipment Efficiency Factor Analysis
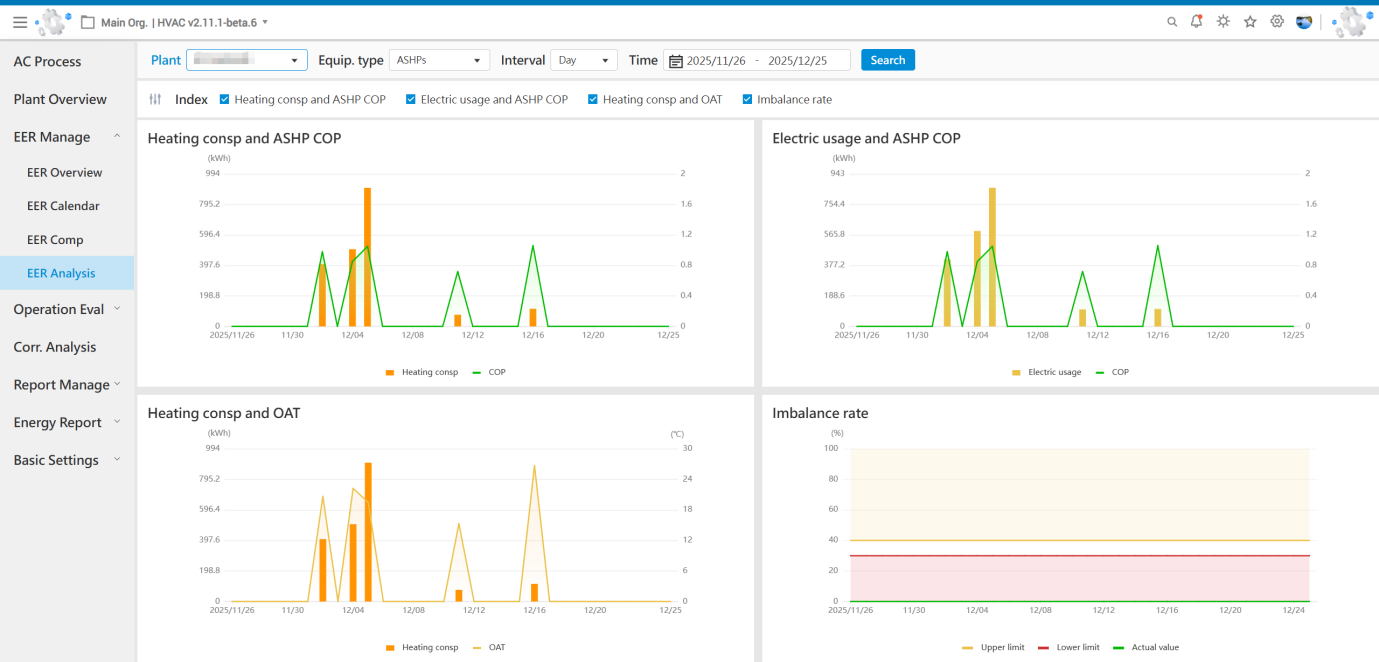
The heating/cooling source equipment type supports five metrics - cooling capacity vs chiller KPI, power consumption vs chiller KPI, cooling capacity vs wet-bulb temperature (for water-cooled energy stations), cooling capacity vs outdoor temperature (for ground-source or air-source heat pump energy stations), and runtime imbalance rate and optimal chiller load point - displaying trends within the statistical range according to different data granularities. For ground-source heat pumps with heating capability, the metric terminology automatically adapts (e.g., "cooling capacity" changes to "heating/cooling capacity") while simultaneously displaying both heating and cooling efficiency trends in the graphical area.
Chiller Unit UI Reference
Ground-Source Heat Pump Unit UI Reference
Air-Source Heat Pump Unit UI Reference

2.3.4.2 Chilled Water Side Pump Efficiency Factor Analysis
The energy efficiency factors of chilled water side pumps include five parameters: power consumption trend, operational efficiency, chilled water temperature difference, power consumption ratio, and runtime imbalance rate. The graphical display area automatically adapts according to the number of selected metrics.
Note: The metrics for the air-side circulation pumps of ground-source/air-source heat pumps are identical to those of the chilled water side pumps in water-cooled energy stations.
2.3.4.3 Cooling Water Side Pump Efficiency Factor Analysis
The energy efficiency factors of cooling water side pumps include five parameters: power consumption trend, operational efficiency, cooling water temperature difference, power consumption ratio, and runtime imbalance rate. The graphical display area automatically adapts according to the number of selected metrics.
Note: The metrics for the ground-side circulation pumps of ground-source heat pumps are identical to those of the cooling water side pumps in water-cooled energy stations.
2.3.4.4 Cooling Tower Energy Efficiency Factor Analysis
The energy efficiency factors of cooling towers include five parameters: power consumption trend, heat exchange efficiency analysis, cooling water outlet temperature, power consumption ratio, and runtime imbalance rate. The graphical display area automatically adapts according to the number of selected metrics.