Data Analysis
On this page, you can view statistical data related to the player unit and media under the company, including content performance and interaction metrics. These insights help assess the overall effectiveness of playback and audience engagement.
Player Unit
This section displays detailed statistics for each player unit, including the Monitor unit name, Device name, Location, Effective viewing level, View counts(Ratio), interaction time(Ratio), Sensor event count, Touch event count, and Action. > To view definitions of specific terms, hover over the i icon.
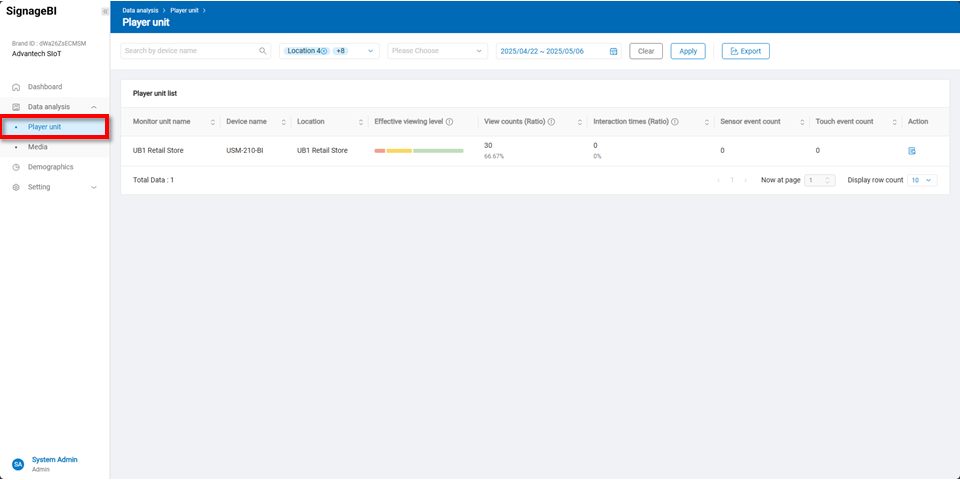
Clicking the Action button opens a detailed view, including View count, Interaction, Gender, age, Foot traffic heatmap, and Information.
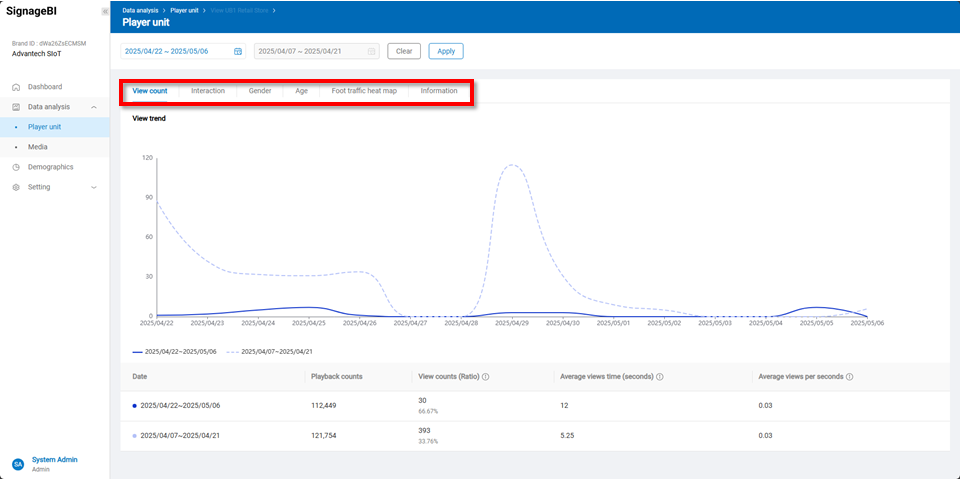
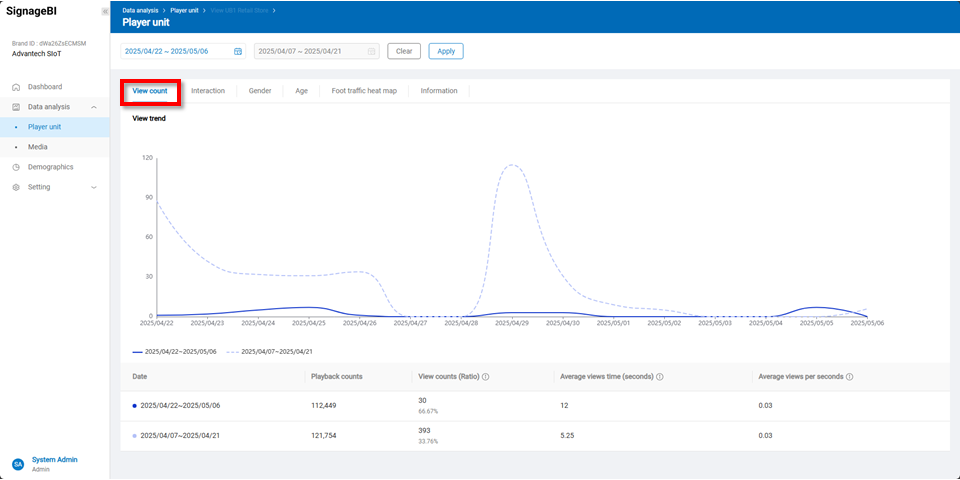
View Count
This chart displays the playback and viewing trends of a playback unit over selected date ranges, including playback counts, view counts(Ratio), Average views time(seconds), and Average views per seconds, helping users evaluate content performance and engagement changes.
Interaction
This chart shows the interaction trends of a playback unit over selected date ranges, including Interaction times, Interaction ratio, Sensor interaction counts, and Touch interaction counts, helping assess audience engagement.
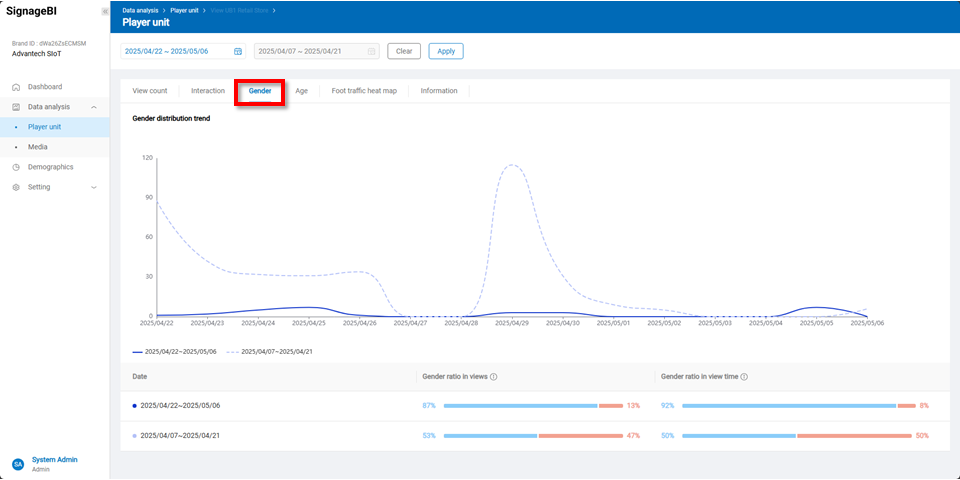
Gender
This chart displays the gender distribution trends of viewers over selected date ranges, showing the proportion of male and female view counts and view durations to analyze audience preferences.
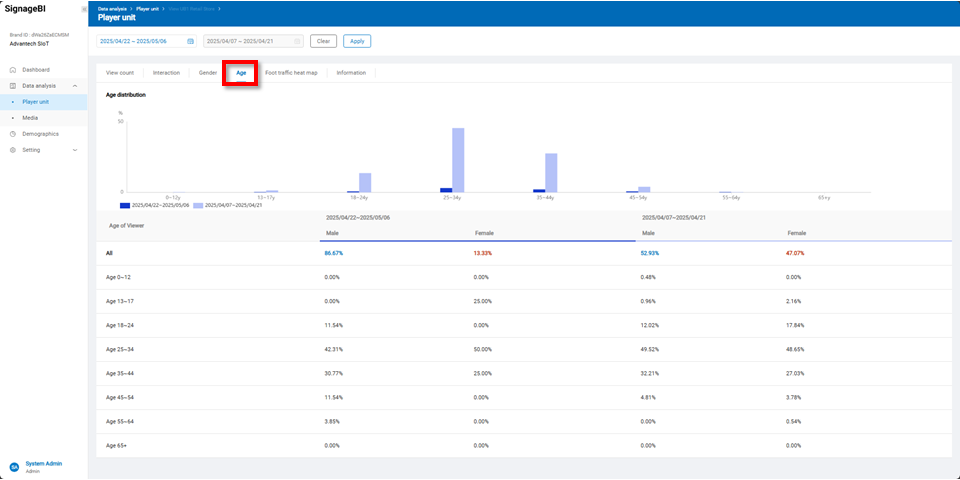
Age
This chart shows the age distribution and gender ratio of viewers, presenting the viewing proportion of males and females across age groups to help analyze target audience demographics and content reach.
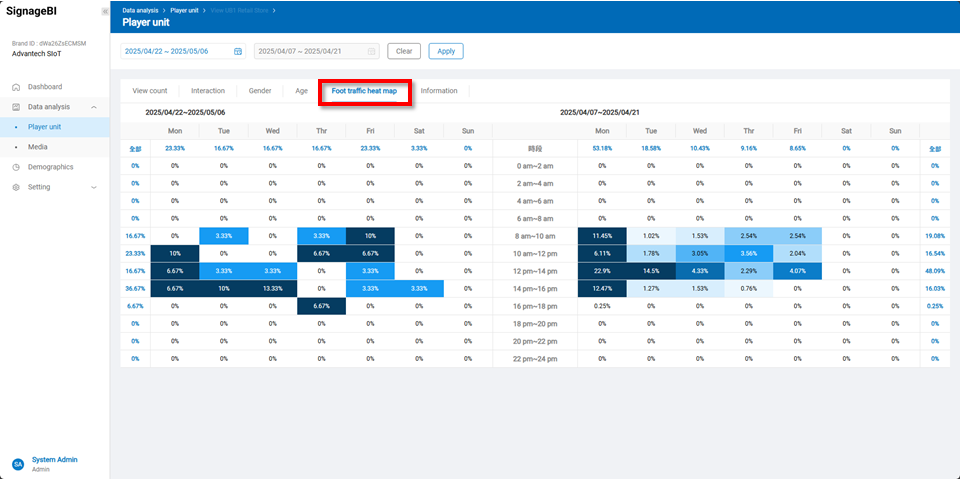
Foot traffic heatmap
This chart presents the viewer distribution by hourly time slots throughout the week. The percentage heatmap helps identify peak hours, supporting decisions on optimal content scheduling for better exposure.
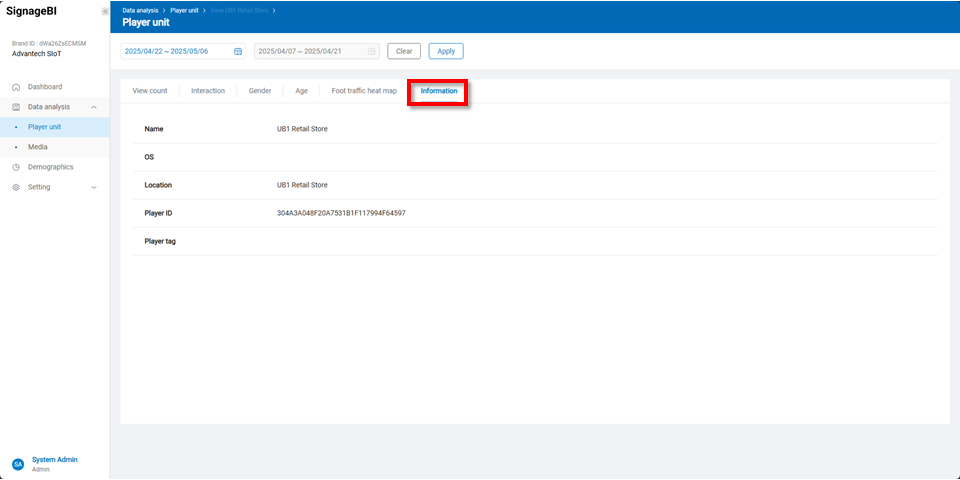
Information
This page displays basic information of the playback unit, including name, OS, location, player ID, and Playre tag helping users quickly identify and manage device sources.
Media
On this page, you can view detailed statistics for each media item, including the Name, Effective viewing level, Total duration (Media length), View Counts(Ratio), Playback counts, Average views time(seconds), Average views per seconds, Interaction times(Ratio), as well as available actions. > To view definitions of specific terms, hover over the i icon.
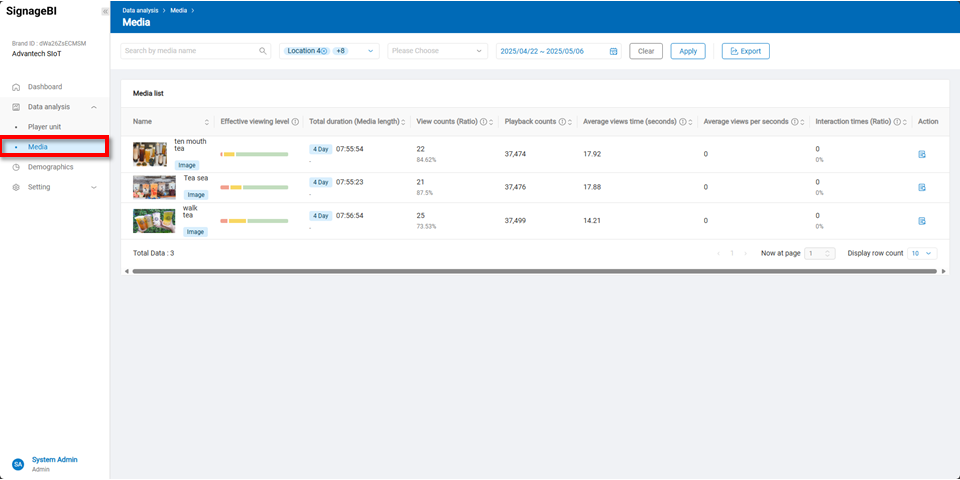
Clicking the Action button to open a detailed view that includes View count, Interaction, Gender, Age, and Information.
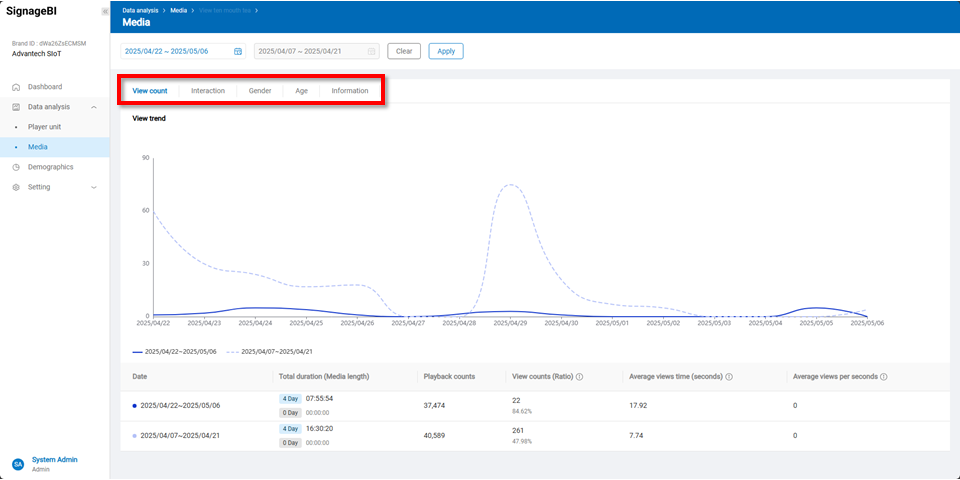
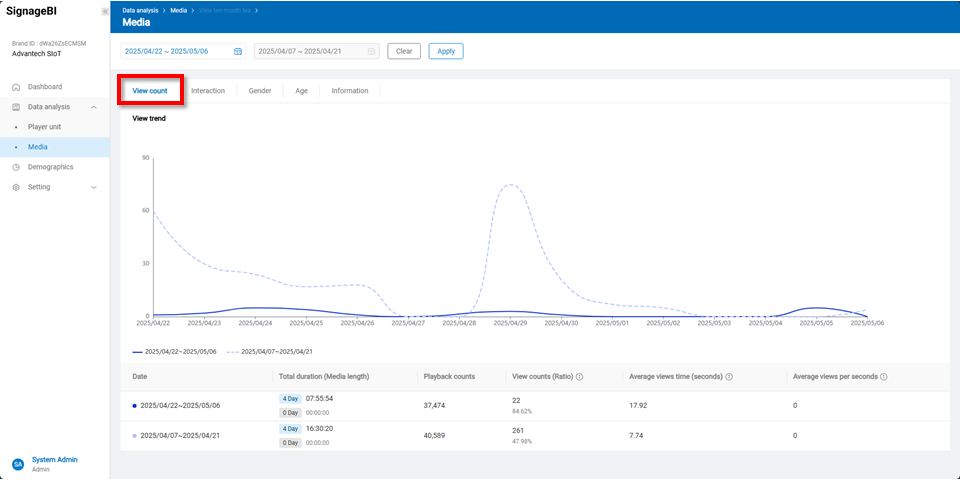
View Count
This chart presents viewing trends of media playback over selected date ranges, including Playback counts, view counts (Ratio), Average views time (seconds), and Average views per seconds.
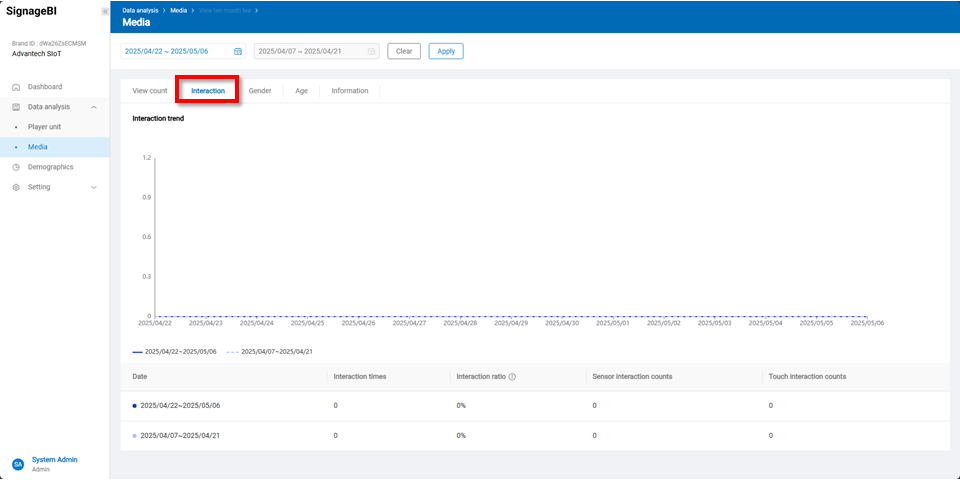
Interaction
This chart displays the interaction trends of media content over selected date ranges, including Interaction times, Interaction ratio, sensor interaction counts, and Touch interaction counts, to assess user engagement and interaction performance.
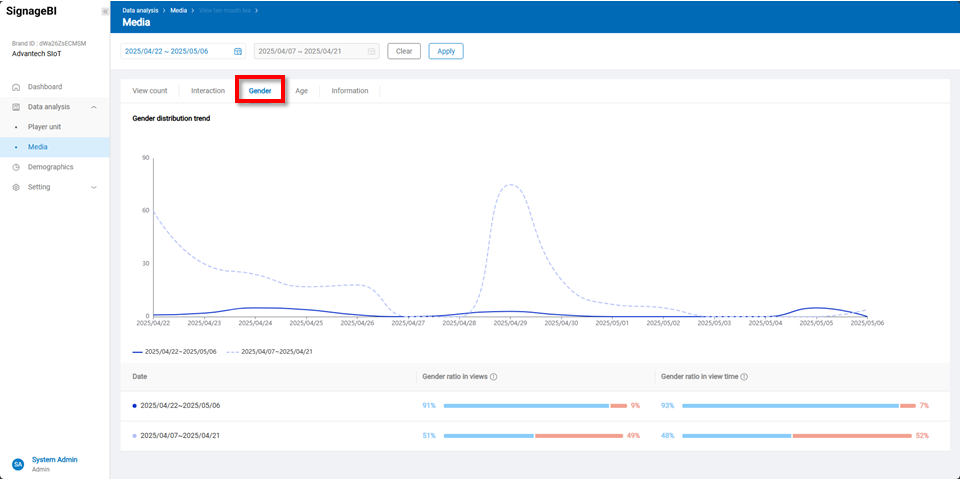
Gender
This chart shows the gender distribution trends of media viewers, comparing male and female view ratios and durations across date ranges to help understand gender-based viewing behaviors.
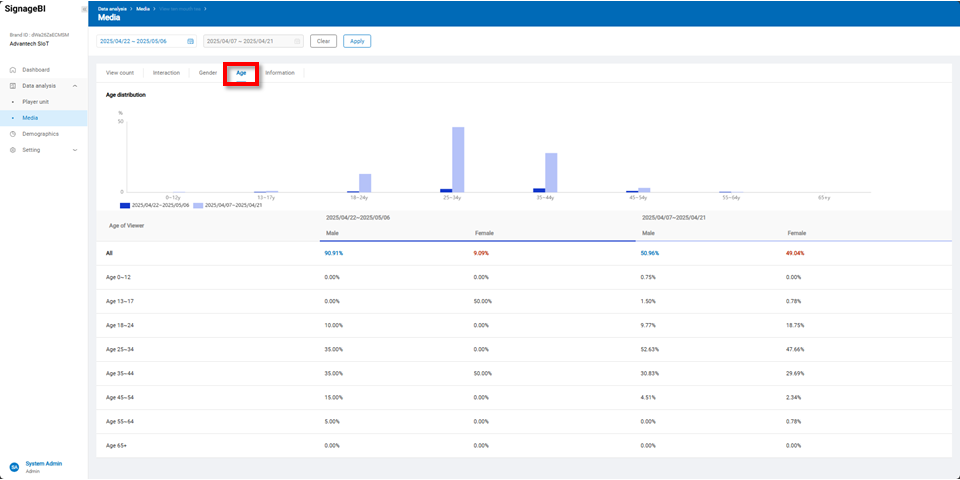
Age
This chart analyzes the age and gender distribution of media viewers, showing male and female view ratios across age groups to help identify audience demographics and content reach performance.
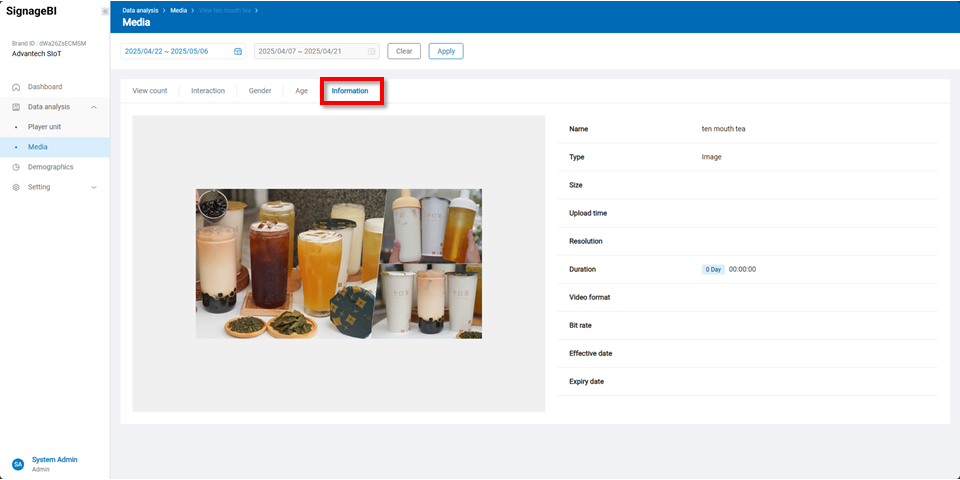
Information
This page shows basic information of the media asset, including name, type, size, upload and activation dates, along with a thumbnail preview to support media management and status tracking.