Event
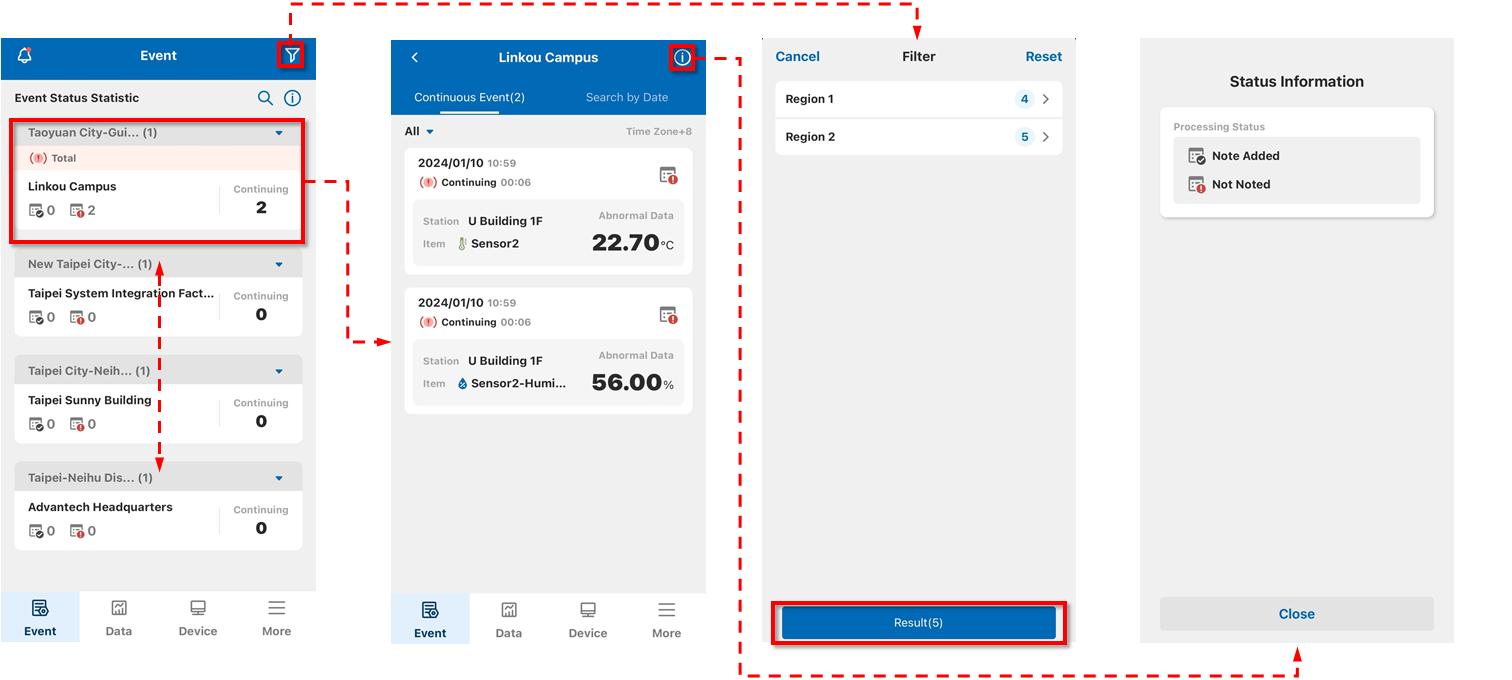
This function allows you to view and handle all abnormal events. On this page, you can see a list of abnormal events that have occurred in the company's monitoring stations. This list includes the time of the abnormal event, the abnormal data, the event status, and the processing status. It allows users to have an overview of the latest event statuses when they open this page. Users can use the filtering button on the right to filter events by region, making it quicker to find the events they want to view. The left-side toggle button allows you to switch between event locations, making it easier to view the status of different events.
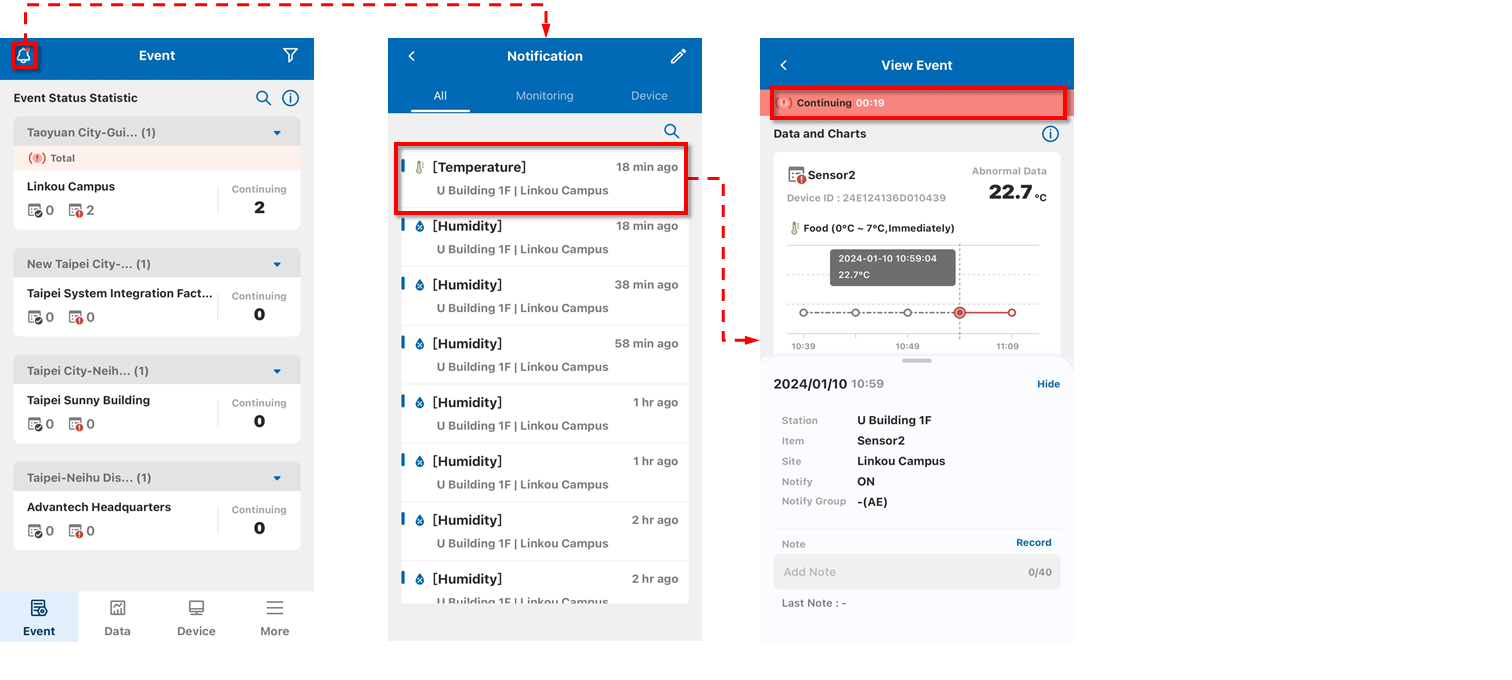
After clicking on the bell icon, you can see notifications for events. Clicking on a notification card will allow you to view detailed event information. If the event is still ongoing, it will be marked as "counting."
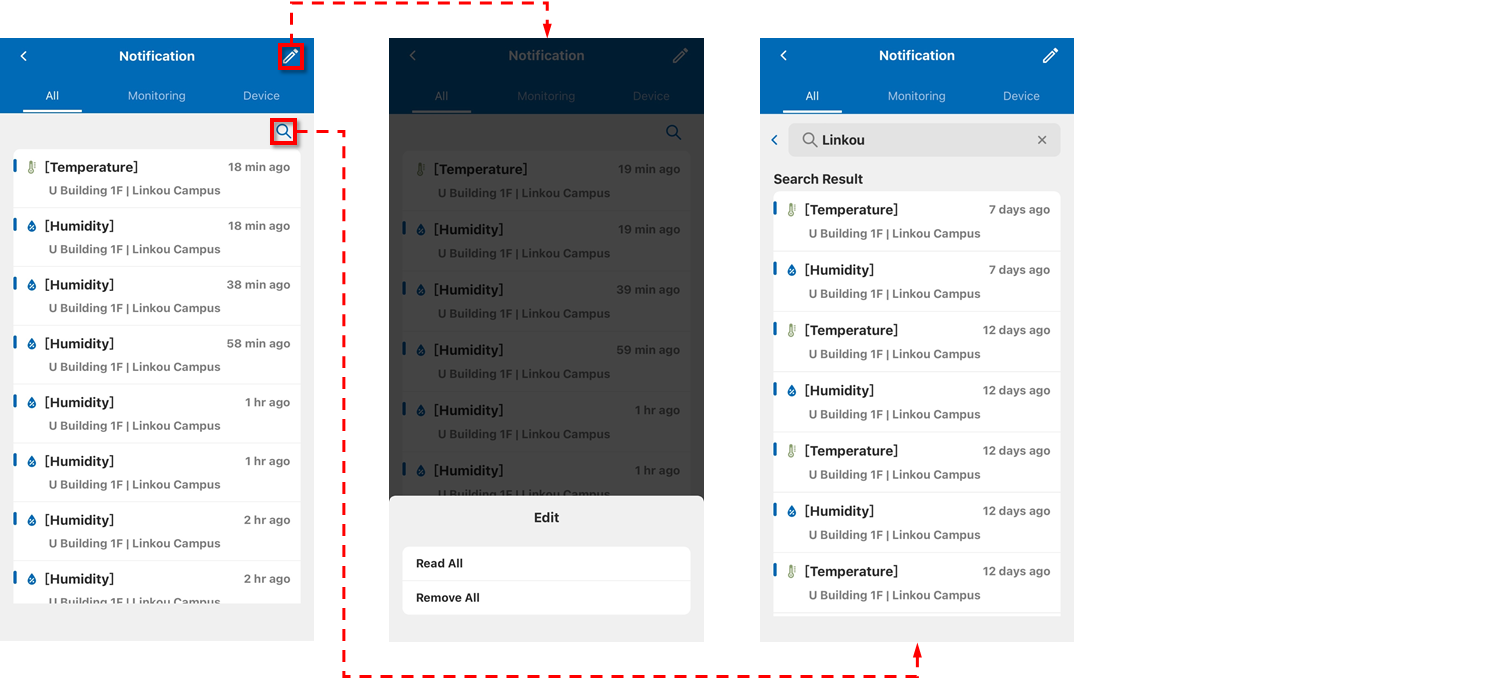
On the notification page, you can click the search![]() icon Search or the edit
icon Search or the edit ![]() icon Edit to search for past records or organize notifications.
icon Edit to search for past records or organize notifications.
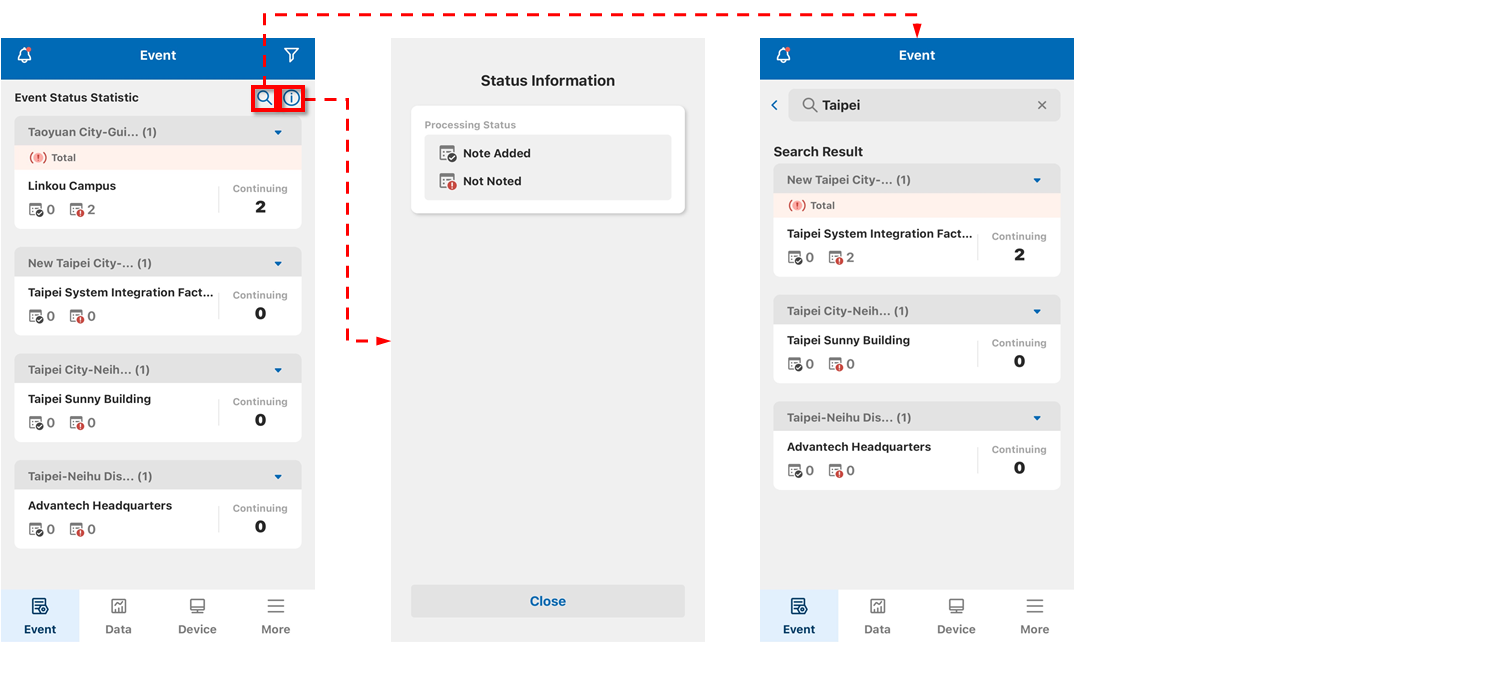
On this page, you can click the search ![]() icon Search and the prompt
icon Search and the prompt ![]() icon Prompt to display corresponding relevant information.
icon Prompt to display corresponding relevant information.
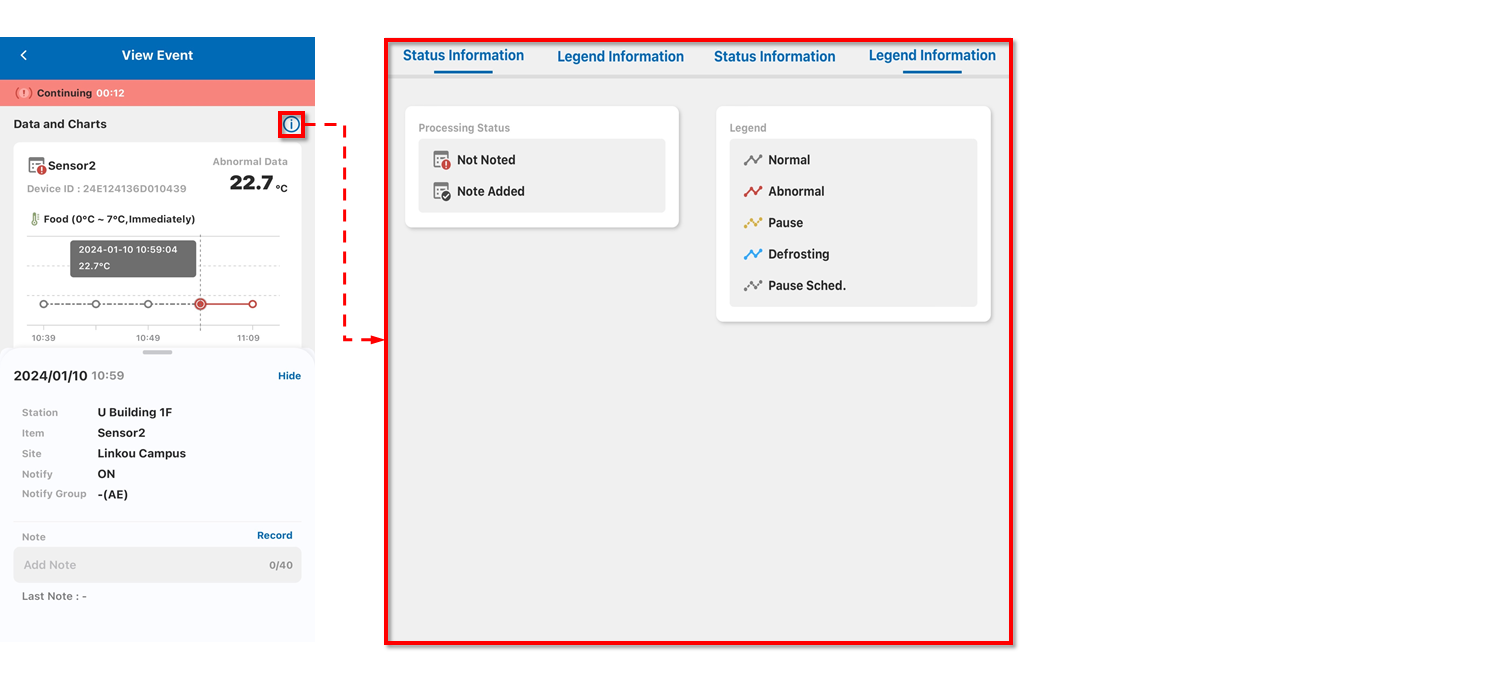
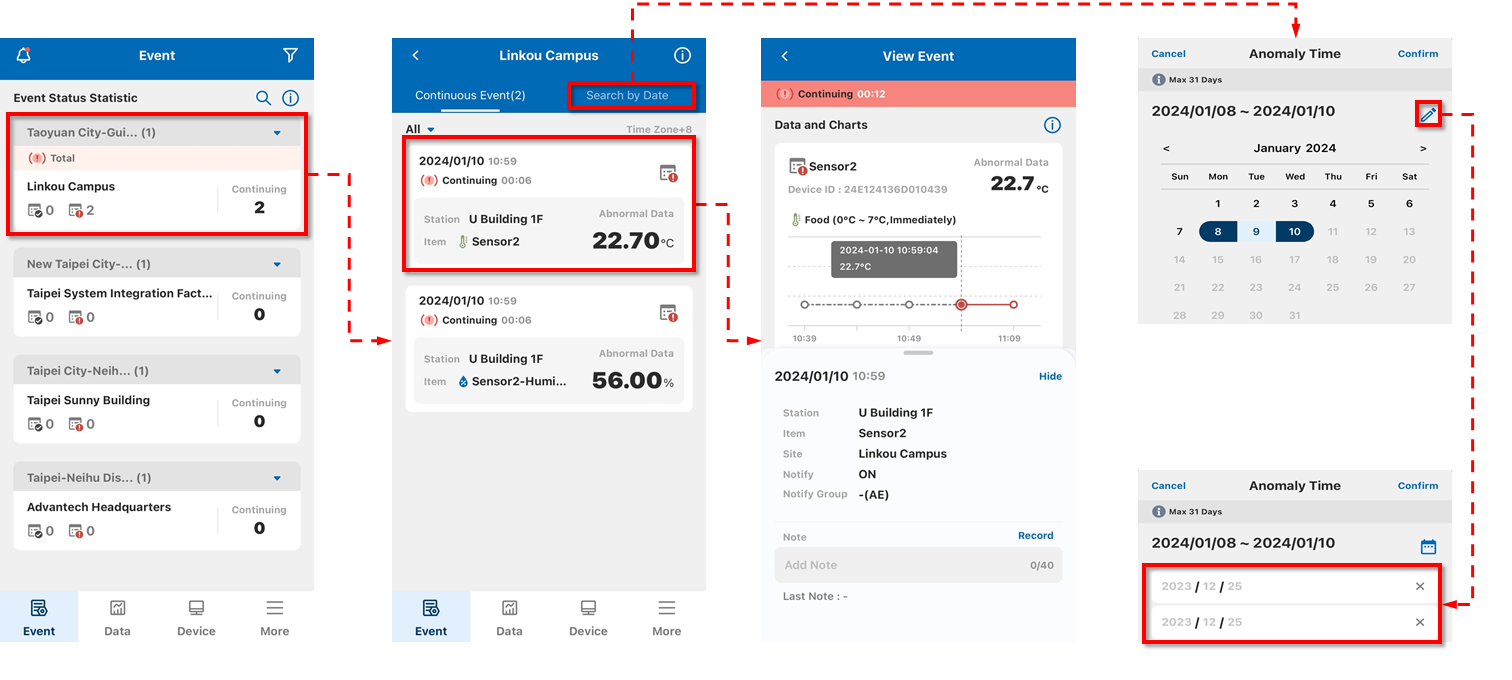
Clicking on the ![]() calendar icon allows you to select events within any three days. Clicking on an event card will display its detailed information.
Users can add notes in the remarks column. After adding a note, the processing status and icon will change from "Note Added" to "Not Noted."
Depending on the user's permissions, the note field may vary; some users can add notes to the event, while others can only view them.
calendar icon allows you to select events within any three days. Clicking on an event card will display its detailed information.
Users can add notes in the remarks column. After adding a note, the processing status and icon will change from "Note Added" to "Not Noted."
Depending on the user's permissions, the note field may vary; some users can add notes to the event, while others can only view them.
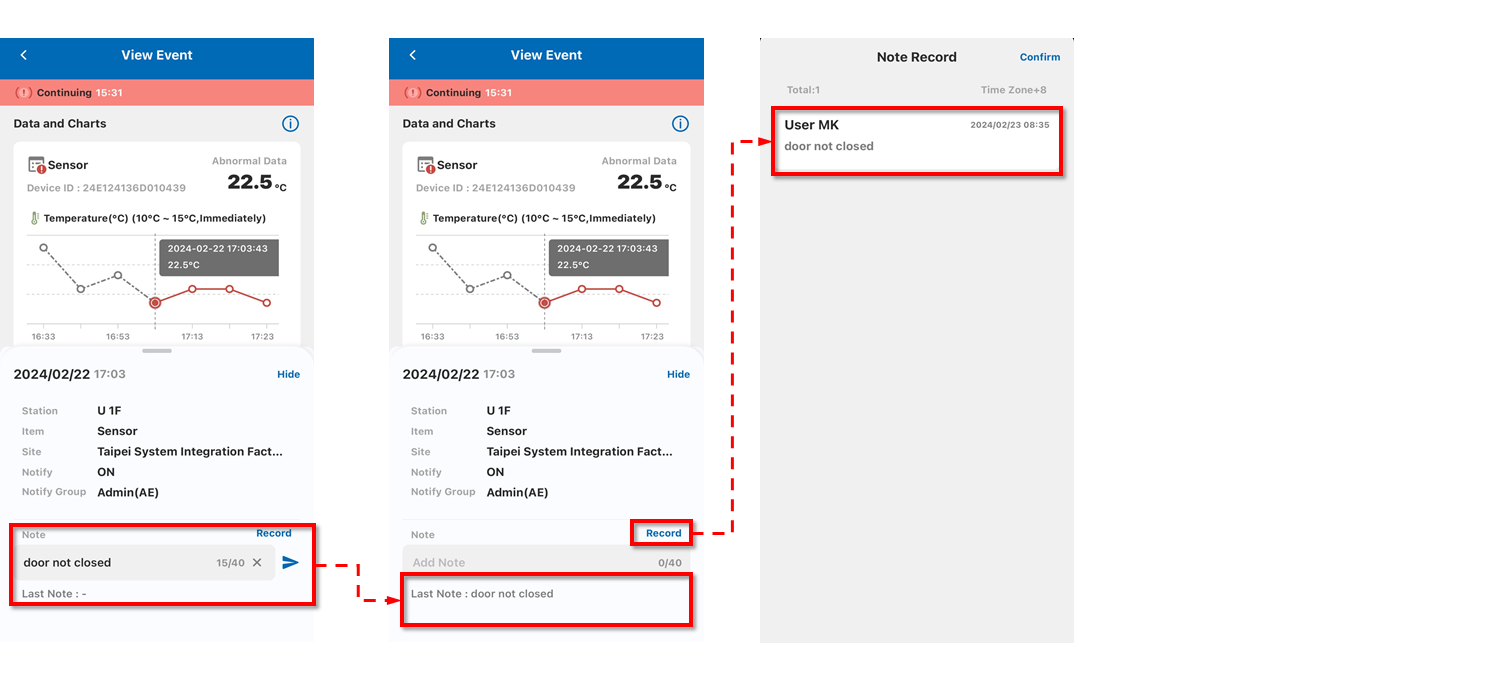
Users with annotation permissions can fill in the main reason for the incident in the annotation field. After completing the filling, they can see the last annotation in the latest annotation, or click on the historical text to view past annotations.
Clicking on the ![]() information icon allows you to understand the detailed status of the card and view the legend explanation.
information icon allows you to understand the detailed status of the card and view the legend explanation.