Statistics are covered in four categories, including "Site overview", "Inspection evaluation", "Event Handling", and "Inspector". The details are as follows:
1. Site Overview
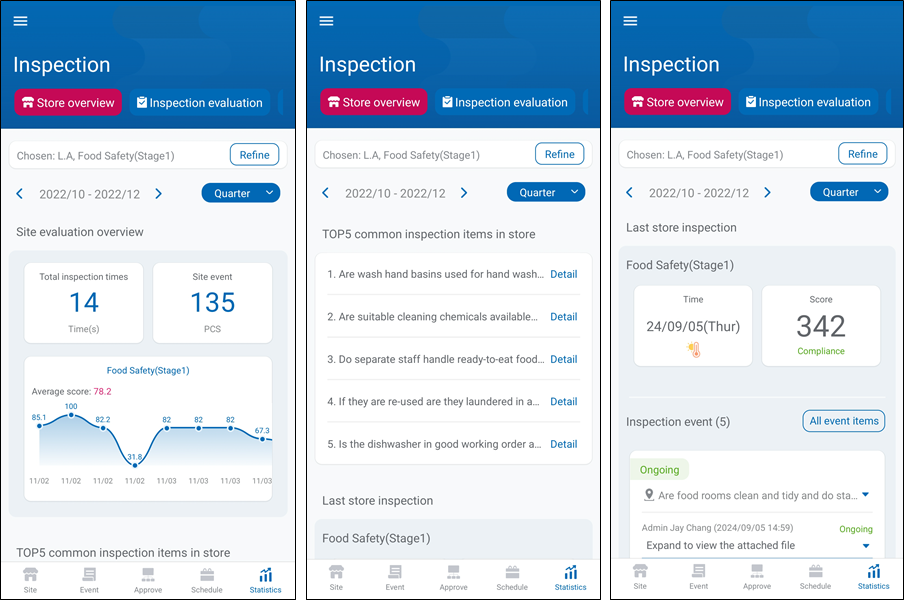
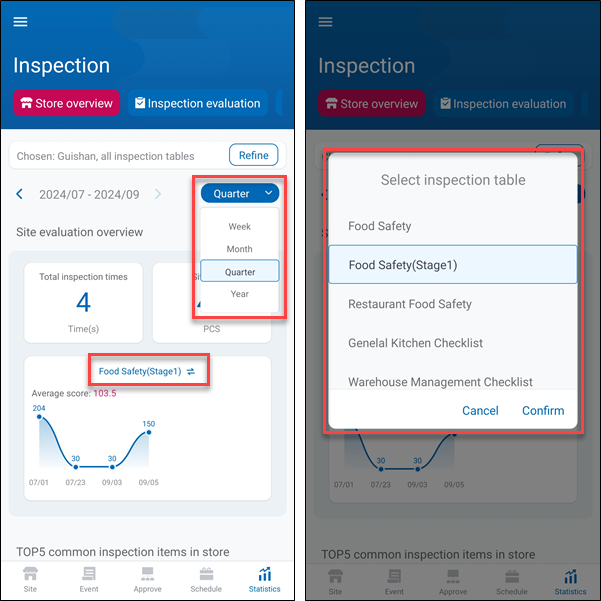
Shows the evaluation status of a single site at a period of time, including the Total Inspection Items and Site Events. Also, based on the recent scores to generate a trend graph for an inspection list.
The "Top 5 common inspection items in site" provide users the information about the top five most common events at this site.
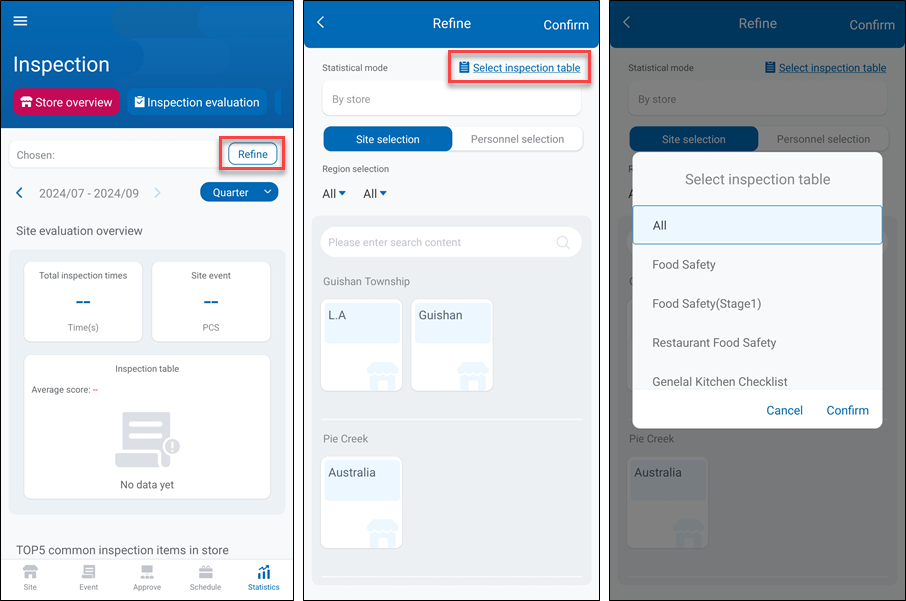
Tap "Refine" to configure the settings.
Tap "Select inspection table" to select an inspection list or all inspection lists for the statistic.
After selecting the inspection list, select a target site and then inspectors. Tap "Confirm" on the top right to complete the statistics settings.
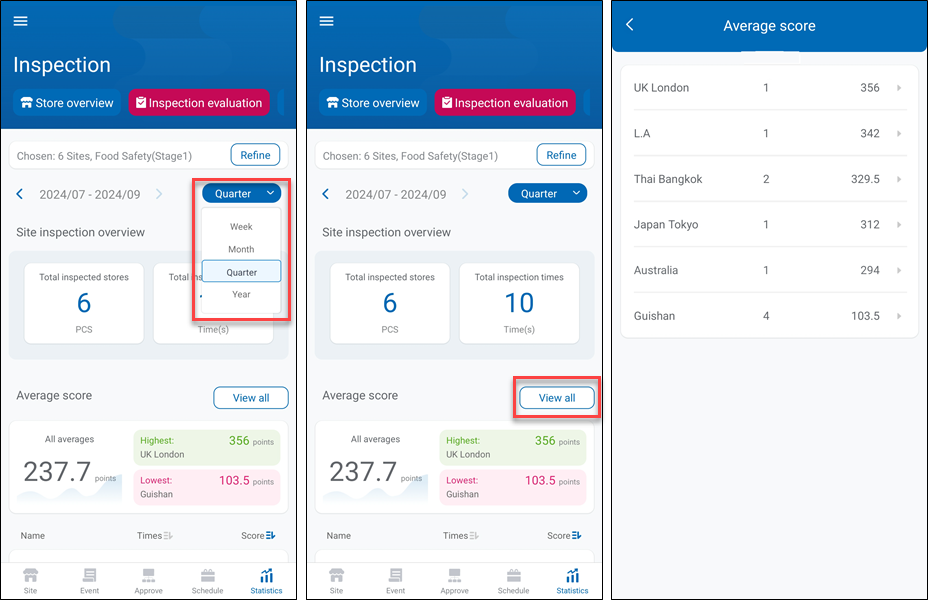
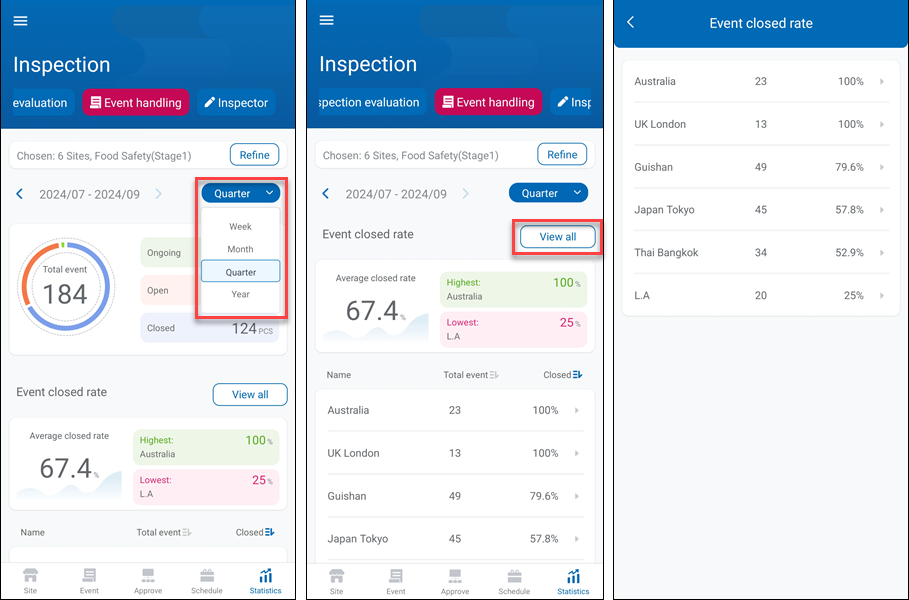
Statistics can be searched in four units of time: Week, Month, Quarter, and Year.
The curve of score can only display for a single inspection list, users can switch inspection list by tapping the inspection list name.
2. Inspection Evaluation
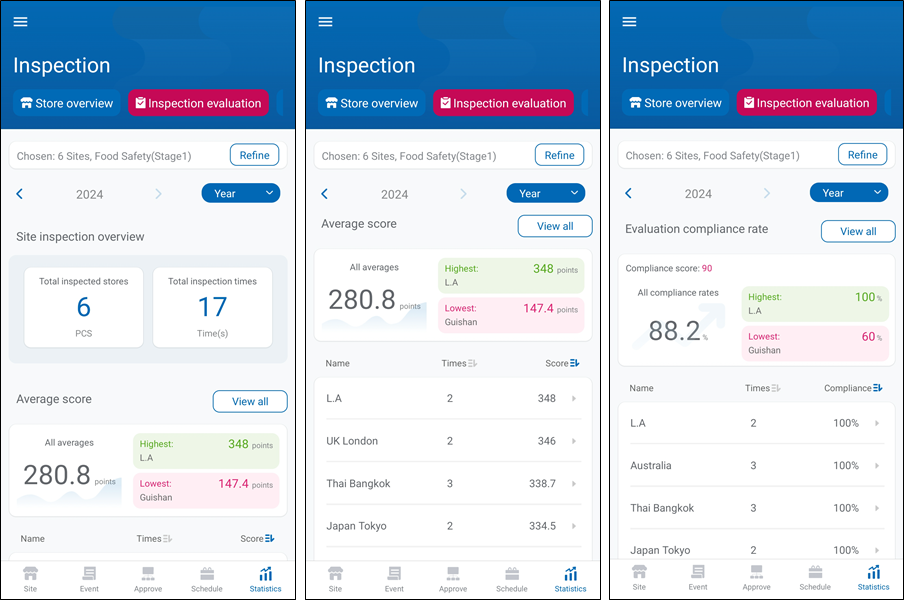
According to the statistical method, inspection evaluation can categorize into "By Site", "By Region", "By Site Group", "By Site Type" and "By Person".
The system will list the value of "Total Inspected Sites" and "Total Inspection Items" according to the statistics settings.
"Average Score" will show all site's average score, also, the highest and lowest average score's site will be highlighted.
"Evaluation compliance rate" will show the inspection score pass rate of each site. (The pass score can be configured in "Inspection rule setting" in the WISE-iService web interface).
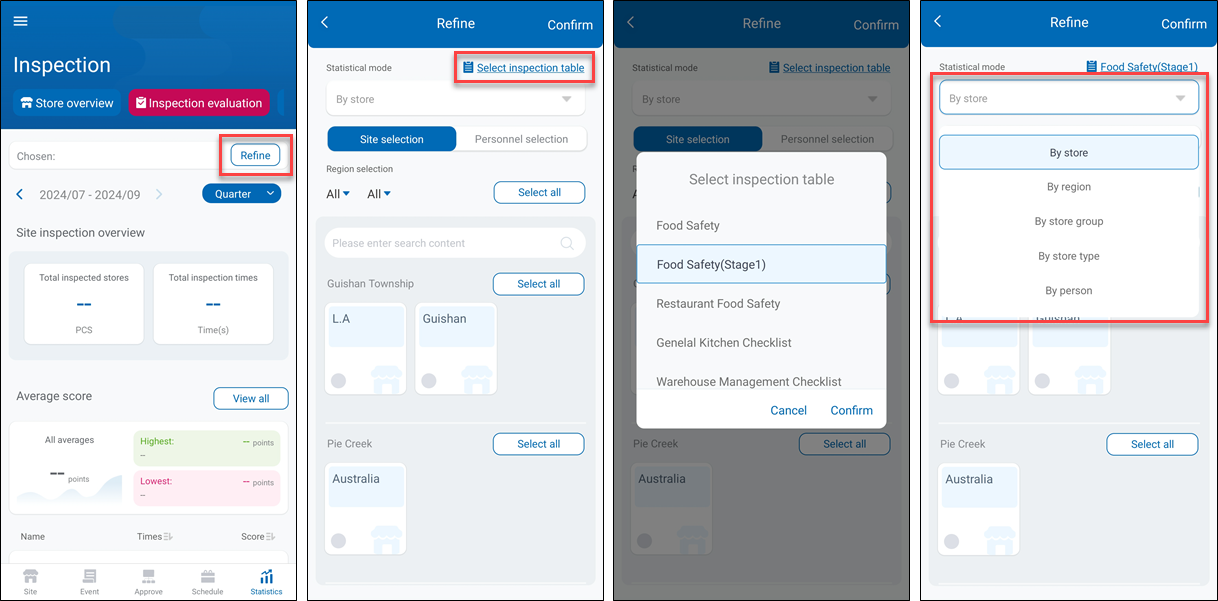
Tap "Refine" to configure the settings.
Tap "Select inspection table" to select an inspection list or all inspection lists for the statistic.
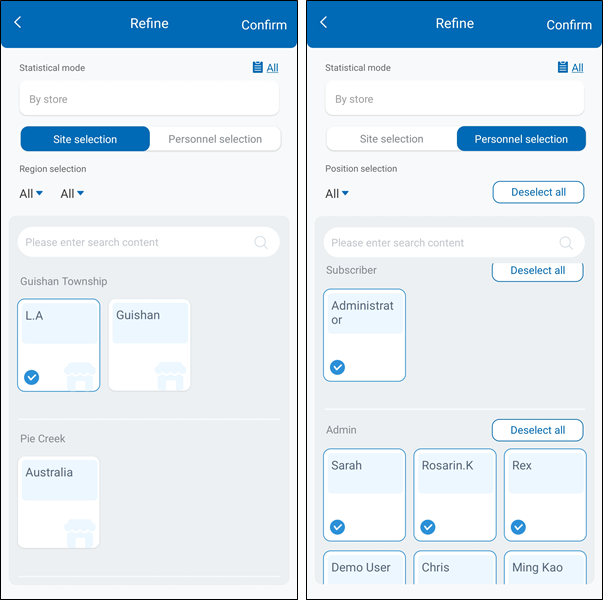
After selecting an inspection list, select the desired Statistical mode and select sites or inspectors.
After completing the selection, tap "Confirm" on the top right to complete the statistics settings.
Statistics can be expressed in four units of time: Week, Month, Quarter, and Year.
Tap "View all" and the system will display all the sites' average evaluation scores based on the statistics settings.
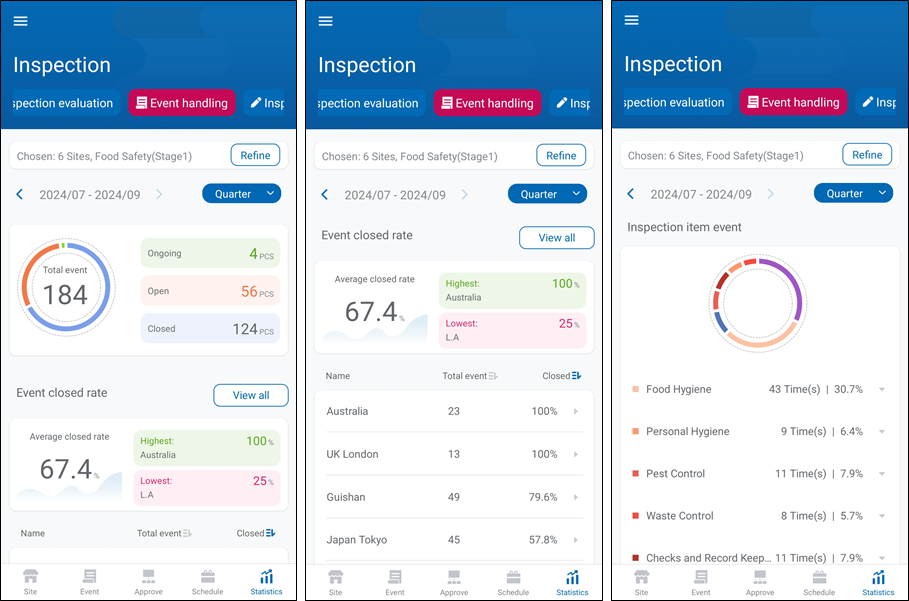
3. Event Handling
According to the statistical method, event handling can categorize into "By Site", "By Region", "By Site Group" and "By Site Type".
The system will show the percentage of "Total Events", "Ongoing", "Open" and "Closed events".
"Event closed rate" will show all sites' event closed average percentage rate, also, the highest and lowest average percentage rate site will be highlighted.
"Inspection item event" will show the percentage of each inspection item according to the inspection list.
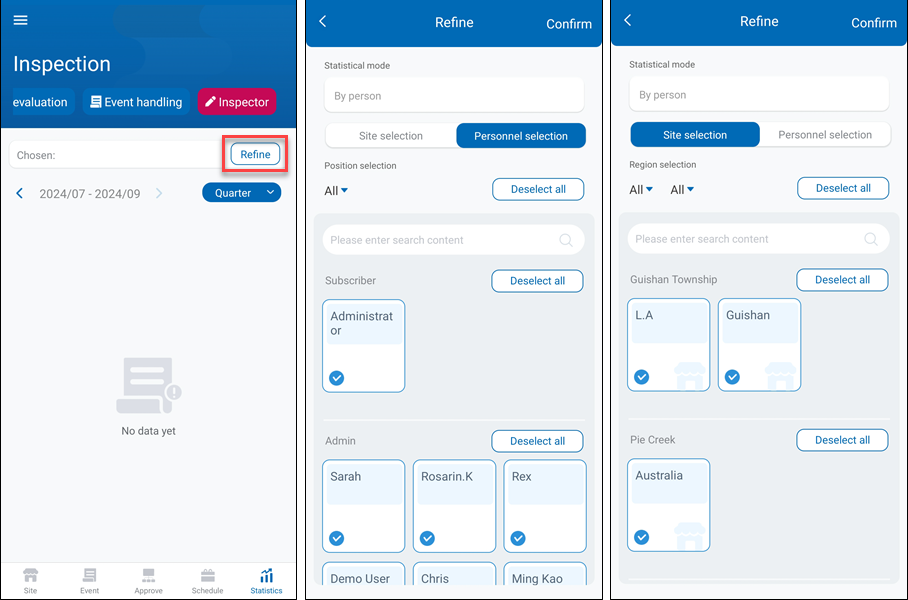
Tap "Refine" to configure the settings.
Tap "Select inspection table" to select an inspection list or all inspection lists for the statistic.
After selecting an inspection list, select the desired Statistical mode and select sites or inspectors.
After completing the selection, tap "Confirm" on the top right to complete the statistics settings.

Statistics can be expressed in four units of time: Week, Month, Quarter, and Year.
Tap "View all" and the system will display all the sites' event closed rate based on the statistics settings.
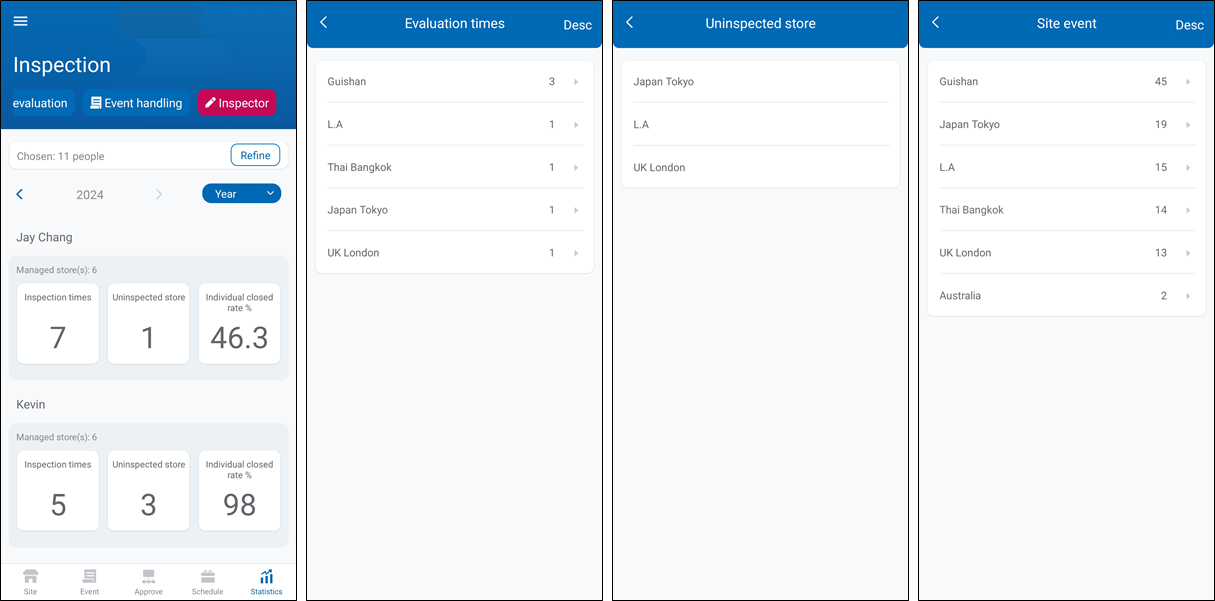
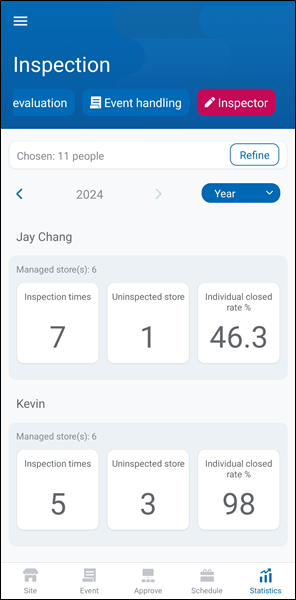
4. Inspector
The system will show each inspector's "Inspection Times", "Uninspected sites" and "Individual closed rate".
Tap "Refine" to configure the settings.
Select an inspector first before selecting a site. After completing the selection, tap Confirm on the top right to complete the statistics settings.
More detailed information can be queried by tapping the "Inspection Times", "Uninspected sites" and "Individual closed rate" options for each inspector.