Operation Analysis
This section conducts an overall operational status analysis from the perspective of the entire air compressor station, including flow and pressure analysis, load rate analysis, etc.
Dew Point Temperature
This function conducts a trend analysis of the moisture content in the compressed air within the entire air compressor station. Select the air compressor station, dryer, and time period, then click Query. You can view the dew point temperature trend corresponding to the selected dryer. Combined with the configured threshold, the red values in the line chart indicate those exceeding the threshold, while the green values represent those below the threshold.

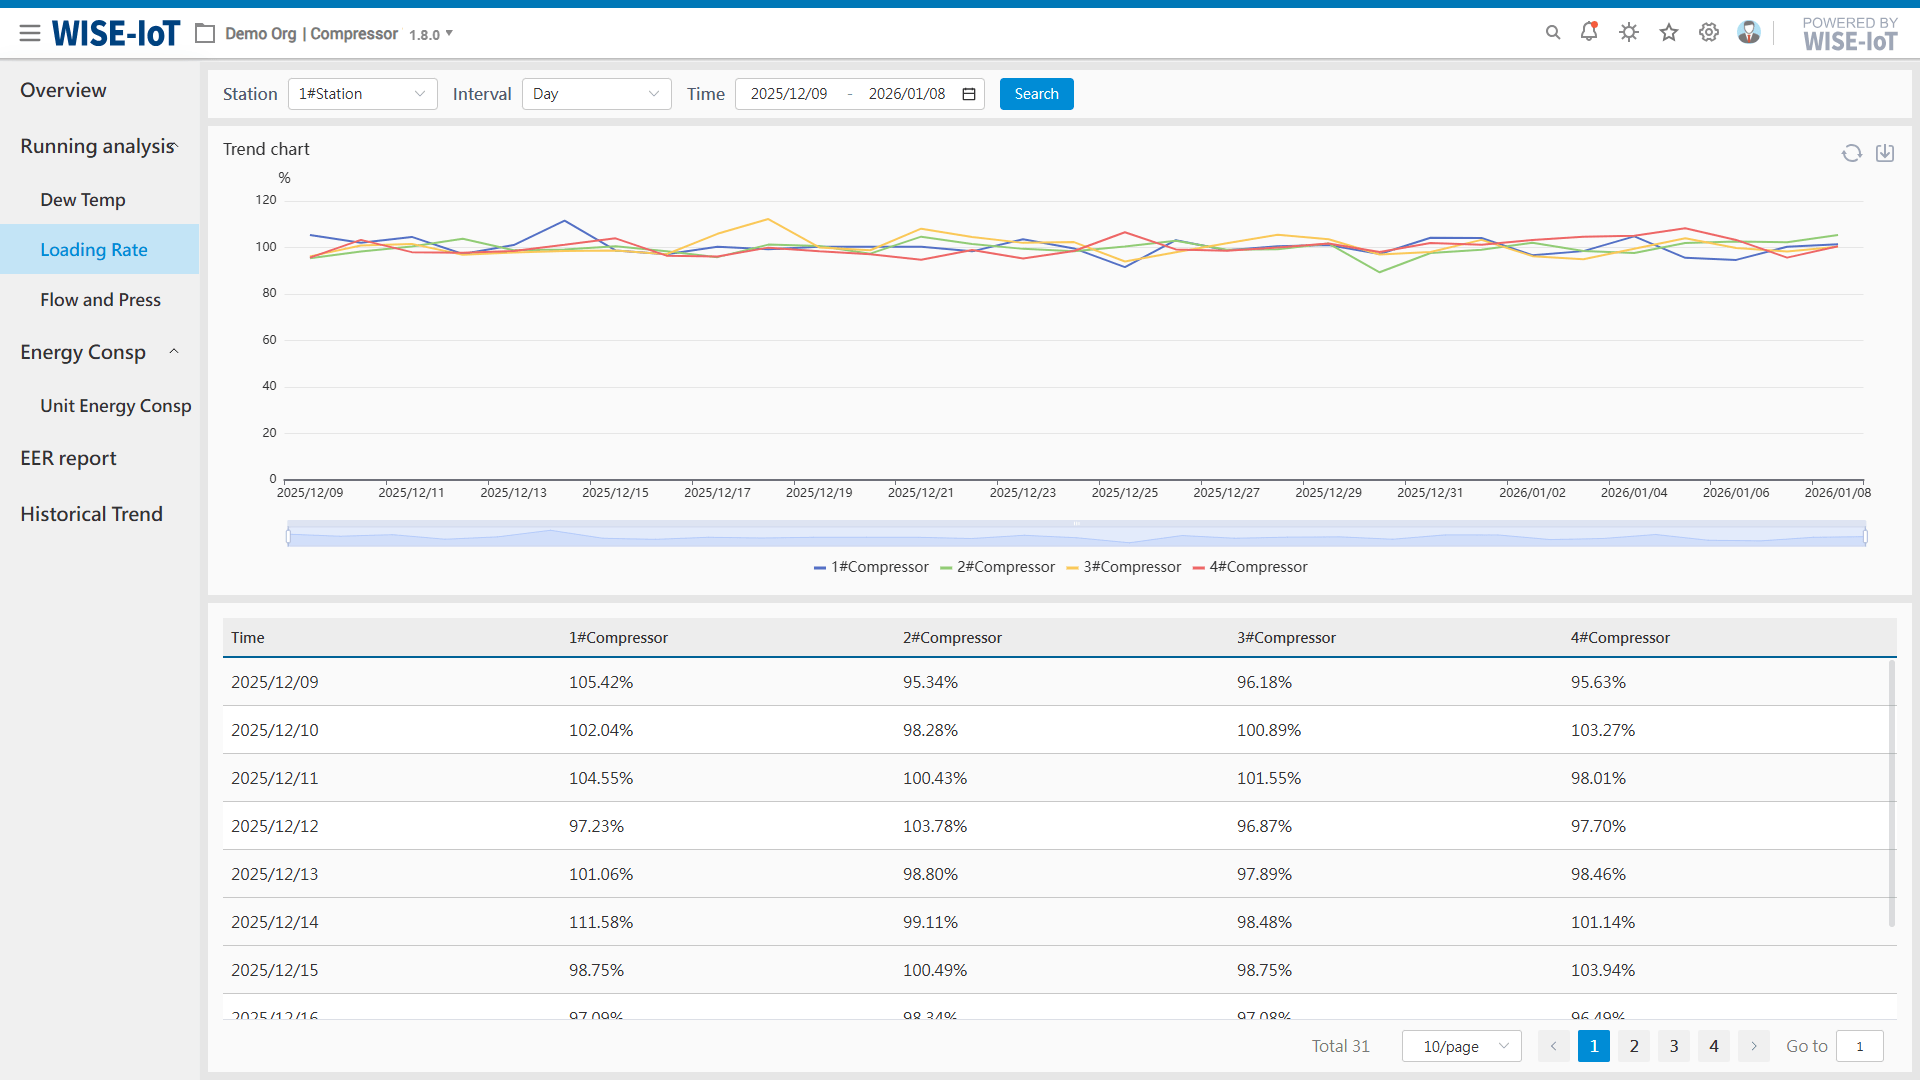
Load Rate Analysis
This function analyzes the proportion of loading status of air compressors within the entire air compressor station. Select the air compressor station and time interval (daily or monthly) and click Query. You can then view the load rate curves and data table of the air compressors.
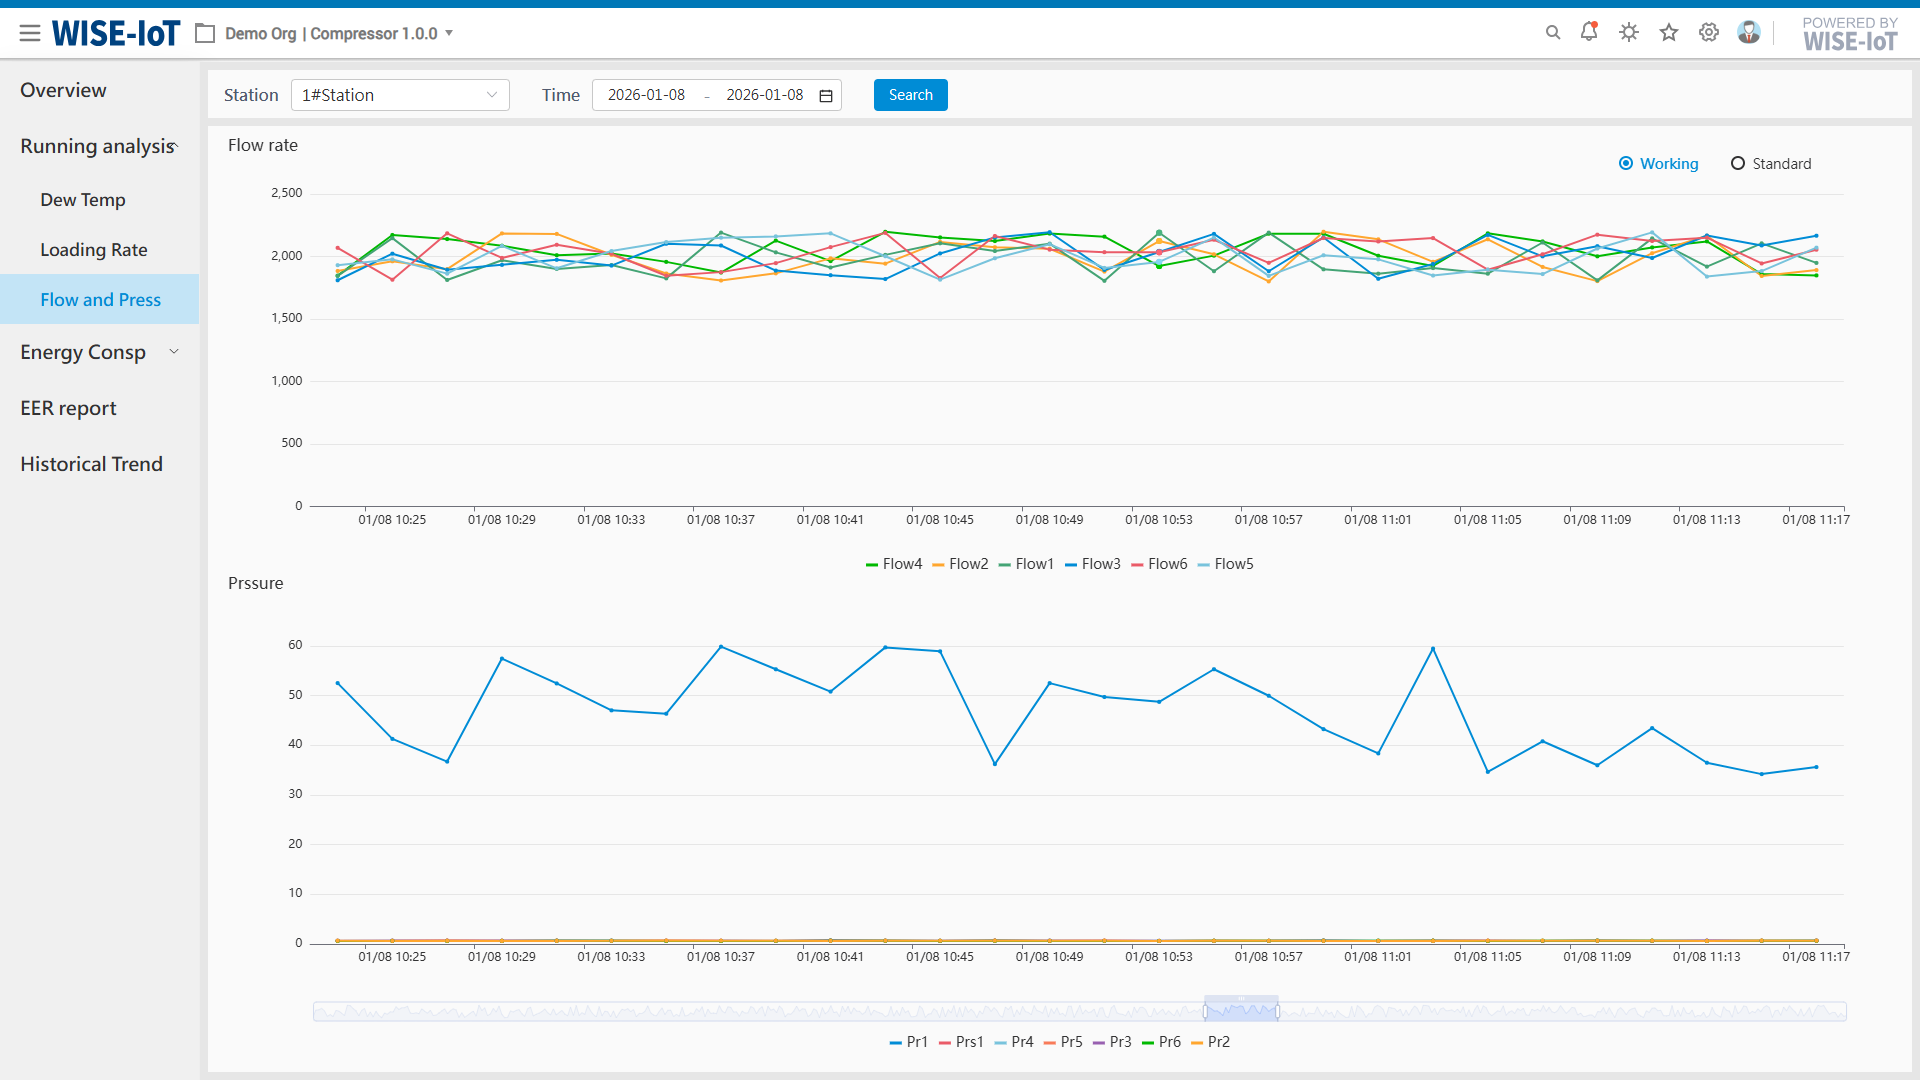
Flow and Pressure Analysis
This function analyzes the flow and pressure of the entire air compressor station. Select the air compressor station and time period, then click Query. You can view the flow and pressure curves of the air compressor station and check the comparison of the two curves during the same period in a linked manner.